|
| Fact Sheet Title Fact Sheet |
| |
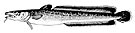
| Ling - Barents Sea, Norwegian Sea, Spitzbergen and Bear Island |
 | Ling (Molva molva) in Subareas 1 and 2 (Northeast Arctic) |
| | Data Ownership | | This document provided, maintained and owned by International Council for the Exploration of the Sea (ICES) , is part of ICES Advice data collection. |
|
| ident Block | ident Block | | | | Species List: | | Species Ref: en - Ling, fr - Lingue franche, es - Maruca, ru - Мольва обыкновенная |
Fishery IndicatorsProduction: Landed Volume; Catch |
|
| ident Block Ling - Barents Sea, Norwegian Sea, Spitzbergen and Bear Island Map tips - Click on
 to turn layers on and off to turn layers on and off - Double-click to zoom in
- Drag to pan
- Hold down the shift key and drag to zoom to a particular region
| fao Sub Area |
|---|
| 27.1 | Barents Sea (Subarea 27.1) |
|---|
| 27.2 | Norwegian Sea, Spitzbergen, and Bear Island (Subarea 27.2) |
|---|
|
|
|
|
|
| Aq Res | Biological Stock: Yes Value: Sub-Regional
Management unit: Yes Reference year: 2018
|
| Considered a management unit: An aquatic resource or fishery is declared as [Fishery] Management Unit if it is effectively the focus for the application of selected management methods and measures, within the broader framework of a management system. According to the FAO Glossary for Responsible Fishing, "a Fishery Management Unit (FMU) is a fishery or a portion of a fishery identified in a Fishery Management Plan (FMP) relevant to the FMP's management objectives." FMU's may be organised around fisheries biological, geographic, economic, technical, social or ecological dimensions , and the makeup and attribute of a fishery management unit depends mainly on the FMP's management objectives. |
| Jurisdictional distribution: Jurisdictional qualifier (e.g. "shared", "shared - highly migratory") of the aquatic resource related with its spatial distribution. |
| Environmental group: Classification of the aquatic resource according to the environmental group (e.g. pelagic invertebrate, or demersal fish) to which the species belong. |
| Reference Year: The Reference Year is the last year considered in the stock assessment and/or fishery status. |
| | | | | | Habitat Bio Depth Zone: Slope (200 m - 1000 m). Vertical Dist: Demersal/Benthic. Water Area Overview Spatial Scale: Sub-Regional Water Area Overview  | | Water Area Overview Ling - Barents Sea, Norwegian Sea, Spitzbergen and Bear Island
| fao Sub Area | 27.1: Barents Sea (Subarea 27.1) | | 27.2: Norwegian Sea, Spitzbergen, and Bear Island (Subarea 27.2) |
| | | | | | Water Area Overview |
Water Area OverviewLing - Barents Sea, Norwegian Sea, Spitzbergen and Bear Island | fao Major | 27: Atlantic, Northeast | | Large Marine Ecosystem Areas (LME) | 19: East Greenland Shelf | | 20: Barents Sea | | 21: Norwegian Shelf | | 22: North Sea | | 58: Kara Sea | | 59: East Greenland Shelf/Sea | | 60: Faroe Plateau | | 64: Arctic Ocean |
Aq Res Struct Biological Stock: Yes Exploit Fishery Indicators | Type | Measure | Value | Unit | Time period |
|---|
| Production | Landed Volume | 6126 | tonnes | 1988 | | Landed Volume | 7368 | tonnes | 1989 | | Landed Volume | 7628 | tonnes | 1990 | | Landed Volume | 7793 | tonnes | 1991 | | Landed Volume | 6521 | tonnes | 1992 | | Landed Volume | 7093 | tonnes | 1993 | | Landed Volume | 6322 | tonnes | 1994 | | Landed Volume | 5954 | tonnes | 1995 | | Landed Volume | 6346 | tonnes | 1996 | | Landed Volume | 5409 | tonnes | 1997 | | Landed Volume | 9200 | tonnes | 1998 | | Landed Volume | 7651 | tonnes | 1999 | | Landed Volume | 5964 | tonnes | 2000 | | Landed Volume | 4957 | tonnes | 2001 | | Landed Volume | 7132 | tonnes | 2002 | | Landed Volume | 6157 | tonnes | 2003 | | Landed Volume | 6560 | tonnes | 2004 | | Landed Volume | 6306 | tonnes | 2005 | | Landed Volume | 8848 | tonnes | 2006 | | Landed Volume | 10334 | tonnes | 2007 | | Landed Volume | 11346 | tonnes | 2008 | | Landed Volume | 8564 | tonnes | 2009 | | Landed Volume | 10580 | tonnes | 2010 | | Landed Volume | 10098 | tonnes | 2011 | | Landed Volume | 8849 | tonnes | 2012 | | Landed Volume | 9027 | tonnes | 2013 | | Landed Volume | 9597 | tonnes | 2014 | | Landed Volume | 8550 | tonnes | 2015 | | Landed Volume | 8822 | tonnes | 2016 | | Landed Volume | 7971 | tonnes | 2017 | | Landed Volume | 11613 | tonnes | 2018 |
Fishery Indicators | Type | Measure | Value | Unit | Time period |
|---|
| Production | Catch | 6126 | tonnes | 1988 | | Catch | 7368 | tonnes | 1989 | | Catch | 7628 | tonnes | 1990 | | Catch | 7793 | tonnes | 1991 | | Catch | 6521 | tonnes | 1992 | | Catch | 7093 | tonnes | 1993 | | Catch | 6322 | tonnes | 1994 | | Catch | 5954 | tonnes | 1995 | | Catch | 6346 | tonnes | 1996 | | Catch | 5409 | tonnes | 1997 | | Catch | 9200 | tonnes | 1998 | | Catch | 7651 | tonnes | 1999 | | Catch | 5964 | tonnes | 2000 | | Catch | 4957 | tonnes | 2001 | | Catch | 7132 | tonnes | 2002 | | Catch | 6157 | tonnes | 2003 | | Catch | 6560 | tonnes | 2004 | | Catch | 6306 | tonnes | 2005 | | Catch | 8848 | tonnes | 2006 | | Catch | 10334 | tonnes | 2007 | | Catch | 11346 | tonnes | 2008 | | Catch | 8564 | tonnes | 2009 | | Catch | 10580 | tonnes | 2010 | | Catch | 10098 | tonnes | 2011 | | Catch | 8849 | tonnes | 2012 | | Catch | 9027 | tonnes | 2013 | | Catch | 9597 | tonnes | 2014 | | Catch | 8550 | tonnes | 2015 | | Catch | 8822 | tonnes | 2016 | | Catch | 7971 | tonnes | 2017 | | Catch | 11613 | tonnes | 2018 |
Management Management unit: Yes Sources ICES Advice accessed through ICES Stock Assessment Database in 2020. ICES, Copenhagen.  http://standardgraphs.ices.dk/ViewCharts.aspx?key=12907 http://standardgraphs.ices.dk/ViewCharts.aspx?key=12907 |
|
| |
|