Marine resources - Southwest Pacific|
| Fact Sheet Title Fact Sheet |
| | | Marine resources - Southwest Pacific |
 | All resources in FAO Statistical Area 81 |
| | Data Ownership | | This document owned by Food and Agriculture Organization (FAO), provided and maintained by Marine and Inland Fisheries Branch (FIRF) , is part of FAO Global Marine Fishery Resource Reports data collection. |
| | ident Block | ident Block | | | | Species List: All aquatic species | |
|
| ident Block Marine resources - Southwest Pacific Map tips - Click on
 to turn layers on and off to turn layers on and off - Double-click to zoom in
- Drag to pan
- Hold down the shift key and drag to zoom to a particular region
| fao Major |
|---|
| 81 | Pacific, Southwest |
|---|
|
|
|
|
| | Aq Res | Biological Stock: No Value: Regional
Management unit: No Reference year: 2009
|
| Considered a management unit: An aquatic resource or fishery is declared as [Fishery] Management Unit if it is effectively the focus for the application of selected management methods and measures, within the broader framework of a management system. According to the FAO Glossary for Responsible Fishing, "a Fishery Management Unit (FMU) is a fishery or a portion of a fishery identified in a Fishery Management Plan (FMP) relevant to the FMP's management objectives." FMU's may be organised around fisheries biological, geographic, economic, technical, social or ecological dimensions , and the makeup and attribute of a fishery management unit depends mainly on the FMP's management objectives. |
| Jurisdictional distribution: Jurisdictional qualifier (e.g. "shared", "shared - highly migratory") of the aquatic resource related with its spatial distribution. |
| Environmental group: Classification of the aquatic resource according to the environmental group (e.g. pelagic invertebrate, or demersal fish) to which the species belong. |
| Reference Year: The Reference Year is the last year considered in the stock assessment and/or fishery status. |
| | | | | | Aq Res State Trend To access all FIRMS State and Trend summaries available for this Area, please look at: Status and Trend Summaries (extracted from reports)This section discusses the stock status of the major fish species that contribute large catches and have stock assessments completed (Table D16). Blue grenadier, Australia The long-term recommended biological catch (RBC) of blue grenadier estimated by the Slope Resource Assessment Group (SlopeRAG) was 4 700 tonnes (SlopeRAG, 2010). The agreed TAC (global) set by the AF MA Commission for the 2009–10 fishing season was 4 700 tonnes. However, the actual TAC (global) was 4 851 tonnes once carryover of uncaught quota was taken into account. The 2009–10 total catch was 3 281 tonnes. There are two distinct blue grenadier fisheries: a fishery targeting spawning aggregations off western Tasmania between late May and early September, and a non-spawning fishery where the catch is caught during general commonwealth trawl sector (CTS) trawling. In 2008–09, the spawning fishery caught 70 percent of the CTS catch.
An age-structured, integrated assessment model for blue grenadier was last updated in 2008, with data up to 2007. The 2008 model estimated that the female spawning biomass was at 0.71B0 (71 percent of the unfished biomass) in 2007. This was projected to decline to 0.5B0 in 2009 if catches followed the RBC, as the abundance of strong cohorts from the mid-1990s declined. Most recent catch has taken from the relatively less abundant younger cohorts. The model suggested that the long-term RBC would be about 4 700 tonnes.
SlopeRAG examined standardized CPUE from the non-spawning fishery (Haddon, 2010a), the results of the 2008 acoustic biomass survey (SlopeRAG, 2010) and the size and age composition data (Hobsbawn, 2009). The size and age composition indicate that a new, relatively strong cohort is starting to enter the fishery. Taken together, these indicators and the projection from the 2008 assessment do not raise concerns. The stock remains assessed as not overfished in 2009, and current catch levels indicate that the stock is not subject to overfishing (Stobutzki et al., 2010). Orange roughy, Australia Orange roughy is distributed in the Cascade Plateau, and the east, south and west zones, but its stock structure in Australia remains unclear despite considerable research. It is also worth noting that the south and west zones are not part of FAO Statistical Area 81. The assessments for orange roughy in the east, south and west zones were formally examined in 2008. There is no targeted fishing for orange roughy in these zones. Given the low recent catches (TACs only reflect incidental catch or catch taken under scientific permits) and the closures that have been introduced, all the zones except the Cascade Plateau remain assessed as overfished but not subject to overfishing in 2009.
The assessment for orange roughy on the Cascade Plateau was updated in 2009 based on new examination of the biomass estimate from the 2005 survey. When the biomass estimate was re-evaluated, it was found to include acoustic marks that were probably not orange roughy, which resulted in an overestimate of biomass. The new estimate of biomass in 2005 is now 18 000 tonnes (down from 31 000 tonnes), which results in an RBC of 315 tonnes. However, the assessment also indicated that the stock is at 64 percent of unfished levels, which is above the limit reference point required under the Orange Roughy Conservation Programme (ORCP) (AFMA, 2006). In addition, and in contrast to the past two years, the acoustic survey showed defined spawning marks of orange roughy on the Cascade Plateau. As it has been determined that the stock is above the limit reference point, and 2009 catches are below the RBC (465 tonnes), Cascade Plateau orange roughy remains assessed as not overfished and not subject to overfishing (Stobutzki et al., 2010). Pink cusk-eel, Australia An age-structured, integrated stock assessment model for pink cusk-eel was updated in 2009 with data up to 2008 (Taylor, 2010). The model assumes separate stocks east and west of Bass Strait and incorporates the standardized CPUE series from the trawl sector (Haddon, 2010a) and non-trawl sector (2003–08 in the east, 2002–08 in the west) and the fisheries research vessel FRV Kapala surveys (Graham, Andrew and Hodgson, 2001).
The 2009 assessment incorporated some significant changes. In particular, depth was included as a factor in the CPUE standardization (Haddon, 2010a). The year up to which recruits were estimated by the model was changed from five years before the latest assessment to three years (east) and four years (west). The model also used a different approach to capture suspected changes in the targeting behaviour by trawlers that may have affected the trawl CPUE. The 2009 assessment is more optimistic than the 2008 assessment, estimating the spawning biomass at the start of 2008 to be 0.37B0 in the east and 0.49B0 in the west (Taylor, 2010). This compares favourably with the estimates of 0.28B0 in the east and 0.33B0 in the west in the 2008 assessment. The most recent assessments (2008 and 2009) do not suggest that the biomass in either region has declined below the limit reference point. Therefore, both stocks are assessed as not overfished, although the eastern stock requires some rebuilding to the target biomass (Stobutzki et al., 2010). Silver gemfish, Australia Silver gemfish (gemfish in Australia) are found from Cape Moreton (Queensland) to Western Australia, including Tasmania. They also occur in New Zealand, but this appears to be a genetically separate stock. In Australian waters, there are two genetically separate stocks. One stock is found on the east coast within Area 81 and the second occurs from the western Bass Strait to Western Australia. This second stock is found outside Area 81, with limited mixing off western Tasmania.
The RBC for western gemfish calculated by SlopeRAG was 102 tonnes for the 2009–2010 fishing season (SlopeRAG, 2010). The 2009–2010 agreed TAC was 125 tonnes; yet the actual TAC was 135 tonnes after the carryover of uncaught quota was taken into account (Stobutzki et al., 2010). The current assessment (Tier 4) suggests that the current CPUE is above the limit reference point and below the target (Haddon, 2010b). However, given the ongoing concern regarding the fact that the Great Australian Bight Trawl Survey data had not been taken into account in the assessment, western gemfish remain assessed as uncertain with regard to whether they are overfished and whether overfishing is occurring (Stobutzki et al., 2010).
In 2009, the assessment of eastern gemfish was moved to the SS3 modelling framework and updated with 2008 survey data (there was no survey in 2009; Little, 2010). The 2008 SSB was estimated to be 0.15B0 (15 percent of unexploited levels), which was similar to the level estimated by the previous assessment. Therefore, eastern gemfish remain assessed as overfished because the current biomass is below the 0.20B0 limit reference point (Stobutzki et al., 2010). South Pacific breams NEI, Australia Catches of South Pacific breams (Seriolella spp.) consist of blue warehou (Seriolella brama) and silver warehou (Seriolella punctata). Blue warehou are typically found in southeast Australia (New South Wales, Victoria, Tasmania and South Australia) and New Zealand. There are two stocks targeted in the Southern and Eastern Scalefish and Shark Fishery, east and west of Bass Strait. Significant catches of blue warehou have been made by Tasmanian fishers.
The Tier 4 assessment for blue warehou was updated in 2009 (Haddon, 2010b). Separate Tier 4 assessments are undertaken for the east and west stocks. The target reference point was the average CPUE from the reference period 1986–1995, and the limit reference point was 40 percent of this target. The recent standardized CPUE series for both east and west stocks was below the limit reference point, indicating that both stocks remain assessed as overfished.
Silver warehou are found along the south coast of Australia from South Australia to Victoria, including Tasmania. A recent study did not indicate the existence of separate stocks east and west of the Bass Strait. Thus, a single stock is assumed for management purposes (Stobutzki et al., 2010). In 2009, a fully updated Tier 1 assessment was undertaken, which included updated catch and discard data. The 2009 assessment indicated that the SSB was 44 percent of unfished levels. The biomass is estimated to have increased to 48 percent in 2010. As the model indicates that the biomass is close to the target stock biomass of 48 percent of the unfished biomass and the levels of catch have been low, silver warehou remains assessed as not overfished and not subject to overfishing (Stobutzki et al., 2010). Blue mackerel, Australia Blue mackerel are found throughout continental shelf waters in southern Australia. Separate stocks have been identified east and west of 146°30’E in Australian waters. Only the east stock is covered by Area 81. No formal stock assessment was made for blue mackerel in 2009. The RBCs in 2008–09 were set using Harvest Strategy rules and relate to the time since the last DEPM survey. The DEPM survey was undertaken in 2005, three years before the RBC was set. The RBC was set at 6 000 tonnes in the east and 8 400 tonnes in the west. These catch estimates are 15 percent of the biomass estimates. After consideration of state catches, the commonwealth TAC was set at 5 400 tonnes in the east and left at 8 400 tonnes in the west. The spawning biomass estimates calculated from the DEPM survey are considered to be between 0.7B0 and 0.9B0. Therefore, both the east and west stocks are assessed as not overfished. Total catches in 2009 were well below the RBCs for both stocks. Therefore, the stocks are assessed as not subject to overfishing (Hobsbawn, Larcombe and Mazur, 2010). Blue grenadier, New Zealand Blue grenadier is called hoki in New Zealand. Annual stock assessment reviews of hoki are undertaken by New Zealand scientists, often in collaboration with international scientists. The process is public, transparent and peer reviewed. The Ministry of Fisheries publishes the outcomes of stock assessments every year and catch limits are reviewed annually based on this information. The New Zealand hoki fishery has been certified by the Marine Stewardship Council.
Hoki are widely distributed throughout New Zealand waters from 34°S to 54°S, from depths of 10 m to over 900 m, with greatest abundance between 200 and 600 m. Large adult fish are generally found deeper than 400 m, while juveniles are more abundant in shallower water. The two main spawning grounds on the west coast of the South Island and in the Cook Strait are considered to comprise fish from separate stocks. This is based on the geographical separation of their spawning grounds and several other factors.
The hoki fishery was developed by Japanese and then-Soviet vessels in the early 1970s. Before the declaration of the EEZ and the implementation of the QMS, catches peaked at 100 000 tonnes in 1977. Hoki was introduced into the QMS in 1986 with a catch limit of 250 000 tonnes. The hoki catch then increased to a peak of 269 000 tonnes in 1997–98. Poor recruitment saw the TACC reduced through the early 2000s to 90 000 tonnes in 2007 and then increase to the current level of 120 000 tonnes as the stock has rebuilt.
Hoki is managed as one administrative stock; however, the western and eastern stocks are assessed separately. Non-regulatory catch limits are in place to ensure that the catch is spread appropriately across the two stocks. The 2011 stock assessment estimated the eastern stock to be at 53 percent B0 and virtually certain (> 99 percent probability) to be above the lower limit of the management target range (35–50 percent B0). The western stock was estimated to be at 41 percent B0 and very likely (> 90 percent probability) to be above the lower end of the management target range. The western stock has been rebuilding in recent years. The biomass is expected to increase at current catch levels and was declared as being fully rebuilt by the stock assessment working group. Southern blue whiting, New Zealand Southern blue whiting (Micromesistius australis) is a schooling species generally confined to sub-Antarctic waters. Although dispersed for much of the year, commercial vessels target southern blue whiting in late winter to early spring when the fish aggregate to spawn at depths of 250–600 m. Four spawning areas have been identified: Bounty Platform, Pukaki Rise, Auckland Islands Shelf and the Campbell Island Rise (MinFish, 2008). These four areas are managed separately as unit stocks. About 20 000–30 000 tonnes of southern blue whiting is caught each year, and it is an important catch for the middle-depths trawl fleet.
The latest assessment shows that the Campbell Island Rise stock has a 40–60 percent probability of being at or above the management target of 40 percent B0 (MinFish, 2011c). For the Campbell Island stock, B2009 was estimated to be 136 000 tonnes, corresponding to 41 percent B0. It is projected that the stock will increase in the next 1–2 years as the recent recruits enter the fishery.
The Bounty Platform stock was assessed in 2009, but data from a 2010 survey led experts to believe the biomass estimates were too high. The current stock status for the Bounty Platform is therefore unknown but is unlikely (< 40 percent probability) to be below 20 percentB0.
The biomass of the Pukaki Rise stock is thought to be stable, while the sustainability of current catch limits in the Auckland Islands stock is unknown (MinFish, 2011d). The National Fisheries Plan for Southern Blue Whiting is currently being finalized; it sets out the management objectives for the next five years. One objective focuses on the continual support for the fishery achieving and maintaining environmental certification. The southern blue whiting trawl fishery is currently seeking environmental certification by the Marine Stewardship Council. Barracouta, New Zealand Barracouta are caught in coastal waters around mainland New Zealand, The Snares and Chatham Islands, down to about 400 m. The species has been managed under the QMS since 1986. Catches increased significantly in the late 1960s and peaked at about 47 000 tonnes in 1977. Between 1983–84 and 2004–05, catches fluctuated between 18 000 and 28 000 tonnes per annum (annual average about 24 000 tonnes). Landings have increased from the lower level of the early 2000s to 27 000–30 000 tonnes in the last four years.
No robust stock assessments have been developed for any barracouta stock, but a fishery characterization and standardized CPUE analyses were carried out for all barracouta stocks in New Zealand with data up to 2007–08. Barracouta management is based on five QMAs, although only three of them support significant levels of catch. The recent characterization and CPUE analyses did not indicate any alarming trends. However, it was concluded that stock assessment models would be necessary to draw conclusions on stock status appropriately. At least one stock is being reviewed in 2011–12 because of anecdotal reports that barracouta are currently very abundant in the southern parts of the New Zealand EEZ. Orange roughy, New Zealand Orange roughy inhabit depths from 700 m to at least 1500 m within the New Zealand EEZ. They are slow-growing, long-lived fish, and on the basis of otolith annuli counts and radiometric isotope studies may live up to 120–130 years. Orange roughy are managed under the QMS with the management objective of maintaining stocks at or above a level that will support the MSY (BMSY). The EEZ is divided into eight orange roughy QMAs. Where more than one discrete orange roughy fishery occurs within a QMA, management subareas have been implemented and separate stock assessments are undertaken for each biological stock. These assessments may result in separate catch limits for each stock.
Stock management is based on the best available independent science. Stock assessment reviews are undertaken every two to three years by New Zealand scientists, often in collaboration with international scientists from the United States of America, Canada and Australia. The stock assessment process is public, transparent and subject to peer review. The Ministry of Fisheries publishes the outcomes of stock assessments annually, and summaries are available on its Web site (see above).
Commercial orange roughy fishing began in New Zealand on the Chatham Rise in the late 1970s – early 1980s, whereas the fisheries in other parts of the New Zealand EEZ typically started in the mid-1980s. Catches peaked in the late 1980s and have decreased since, largely in response to reductions in catch limits as the biomass of the various stocks has been fished down to target levels. More than 9 000 tonnes of orange roughy were landed from the New Zealand EEZ in the 2009–2010 fishing year. The most important fishery is on the east and south Chatham Rise (MinFish, 2010).
In earlier years, the productivity (growth and regeneration rates) of orange roughy was overestimated, leading to some New Zealand orange roughy fisheries being fished to levels below BMSY. As a result, two fisheries were closed to fishing (in 2000 and 2003) to allow rebuilding at the maximum rate. One of these fisheries has since reopened to fishing after the stock was considered to have rebuilt to a sufficient level to allow limited fishing to recommence. The remaining orange roughy fisheries are deemed to be below BMSY, or their status is not known. Conservative catch rates have been implemented to promote the rebuilding of these stocks in the medium term while maintaining commercial fisheries. Oreos, New Zealand There are three species of oreo fished within the New Zealand EEZ: smooth oreo, black oreo and spiky oreo. All three species are managed under the QMS with quota allocated as a combined oreo assemblage. Target fisheries exist for black and smooth oreo in quota management areas. Spiky oreo is taken as a bycatch in these fisheries and all three species are taken as bycatch in the target orange roughy fishery (MinFish, 2010).
Oreo are found predominantly in southern latitudes of the EEZ from the south Chatham Rise to the sub-Antarctic. They are found at depths from 600 to 1 500 m with younger fish typically found towards the shallower end of this depth range. Oreo are long-lived and slow-growing species. Black oreo may reach a maximum size of 45 cm and live for up to 150 years, and smooth oreo may reach a maximum size of 51 cm at an age of 86 years. Spawning for both species occurs from late October to at least December, with an average length at maturity of 34 and 41 cm for black and smooth oreo, respectively.
The annual catch limit for oreos was set at 18 850 tonnes in 2009–2010. Recorded catch was 16 791 tonnes in 2009–2010, down from a peak of 24 799 tonnes in 1996–1997. Smooth and black oreo are divided up into four different management areas. Seven of the eight oreo fisheries have been assessed. Five of the assessments are on smooth oreo and two on black oreo. Two of the eight stocks were estimated to be probably overfished, five at or near the management target of 40 percent B0, and one stock was not assessed (MinFish, 2011c), based on FAO criteria. Habitat Bio Climatic Zone: Temperate; Polar. Water Area Overview FAO Statistical Area 81 includes the Tasman Sea and the Pacific Ocean from the 150°E to the 120°E meridians (Figure B14.1). The total surface area is 27.7 million km2 with only 0.4 million km2 of shelf area. In the Tasman Sea, the well-defined East Australian Current flows south along the east coast of Australia but becomes weaker and diffused south of Sydney. Part of this current system turns east after coming in contact with the more southerly West Wind Drift along the northern edges of the Southern Ocean and southern margin of the Tasman Sea. It then turns north along the two coasts of the South Island of New Zealand. On the east coast of New Zealand, this current encounters the south-flowing East Cape Current. Where the two currents meet, they mix and move offshore to form the Wairarapa Gyre. This gyre is strongest north of the Chatham Rise, a raised part of the sea bed extending to the Chatham Islands farther east.
The region is mostly deep oceanic water, with many seamounts where bathypelagic fish resources such as orange roughy and oreos are exploited. Within the region, there are two shallower plateaus of about 200–1000 m in depth. The largest is the Campbell Plateau, which occurs to the southeast of New Zealand below 46°S. The second, the Lord Howe Rise, is shallower and extends from the centre of New Zealand in a northwesterly direction. This rise continues to the eponymous mid-Tasman Sea islands. 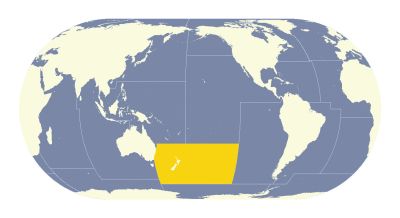 | Figure B14.1 The Southwest Pacific (Area 81)  |
Water Area Overview  | | Water Area Overview Marine resources - Southwest Pacific
| fao Major | 81: Pacific, Southwest |
| | | | | | Water Area Overview |
Water Area OverviewMarine resources - Southwest Pacific | fao Major | 81: Pacific, Southwest | | Large Marine Ecosystem Areas (LME) | 41: East-Central Australian Shelf | | 42: Southeast Australian Shelf | | 46: New Zealand Shelf |
Aq Res Struct Biological Stock: No Exploit The types of habitats that are exploited in this region are very varied. It supports a wide range of fisheries, from coastal continental to deep-water seamount fisheries. In fact, New Zealand and, to a lesser extent, Australia have been pioneers in developing profitable and sustainable deepwater (> 600 m) trawl fisheries. The fisheries within Australian jurisdiction consist of the coastal species of the Australian states of New South Wales, northern Victoria and offshore Tasmania. For New Zealand, there are two main fishing sectors. The first targets pelagic resources in the Southwest Pacific. The second important fishing sector focuses on the bathypelagic species associated with the sea bottom rises from the Tasman Sea east to the south, and east of the South Island of New Zealand. The most important species caught in these fisheries are orange roughy (Hoplostethus atlanticus) and hoki (Macruronus novaezelandiae). PROFILE OF CATCHESNominal catches from the Southwest Pacific increased from less than 50 000 tonnes in 1950 to 917 000 tonnes in 1992 and then gradually declined to 600 000 tonnes in 2009 (Figure B14.2, Table D16). Five taxonomic groups account for 81 percent of the catches: gadids (30 percent), miscellaneous demersal fishes (21 percent), miscellaneous pelagic fishes (11 percent), squids, cuttlefishes and octopuses (10 percent), and tunas, bonitos and billfishes (8 percent) (Figure B14.2). 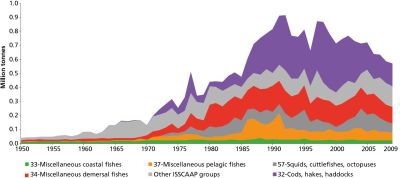 | | FIGURE B14.2 Annual nominal catches by ISSCAAP species groups in the Southwest Pacific (Area 81) |
There are only two countries in Area 81, Australia and New Zealand (Figure B14.1). However, 20 countries and areas/territories have been involved in fishing in the Southwest Pacific region in the past. These include Australia, Canada, China, the Cook Islands, Estonia, Georgia, Japan, the Republic of Korea, Latvia, Lithuania, New Zealand, Norway, Pitcairn Islands, Poland, the Russian Federation, Spain, Taiwan Province of China, Ukraine, the Union of Soviet Socialist Republics, and the United States of America. New Zealand has the largest landings, with a peak of 650 000 tonnes in 1998 and 420 000 tonnes in 2009. Japan caught the second-largest volume in Area 81 and landed 300 000 tonnes in 1988, but withdrew after 2006. Australia’s landings from Area 81 increased gradually from 10 000 tonnes in 1950 to 30 000 tonnes in 1985, and then experienced a rapid growth to a peak of 80 000 tonnes in 1990. The total catch then fell sharply to about 20 000 tonnes in 2009. The Republic of Korea also has a strong presence in Area 81. Its catch increased rapidly from zero in 1964 to 60 000 tonnes in 1978. After a period of dramatic decline in the early 1980s, the catch recovered to about 50 000 tonnes in 2009 (Figure B14.3). 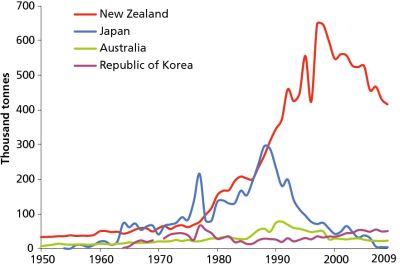 | | Figure B14.3 Annual nominal catches by major fishing countries, Southwest Pacific (Area 81) |
About 30 percent of the total landings in Area 81 are of ISSCAAP Group 32 (cods, hakes, haddocks) (Figure B14.4). Within this group, the largest catch is of blue grenadier. Catches of this species were first recorded in 1973 and quickly increased to about 300 000 tonnes by 1998. However, the landings of gadids dropped rapidly after the peak to under 100 000 tonnes in 2009. Southern blue whiting is the second most fished species of Group 32. Its landings vary greatly from year to year. Although the catch of southern blue whiting peaked at 80 000 tonnes in 1992, the landings in 2009 were close to 50 000 tonnes and similar to those recorded in the early 1970s. Red codling and southern hake are ranked the third- and fourth-most important species with peak catches between 15 000 and 20 000 tonnes. The fisheries for these four main species all experienced clear declines in catch after 2000. 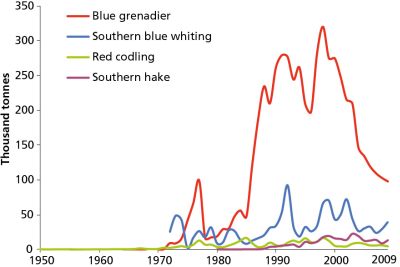 | | Figure B14.4 Annual nominal catches of selected species in ISSCAAP Group 32, Southwest Pacific (Area 81) |
Orange roughy, snoek, oreo dories NEI, and demersal percomorphs NEI are the top four species groups of ISSCAAP Group 34 (miscellaneous demersal fishes) in Area 81. They contribute 21 percent of the total catches (Figure B14.2). Orange roughy was not recorded in the catch before 1979. After that time, its catch increased rapidly to reach a record high of more than 80 000 tonnes in 1990 (Figure B14.5). A dramatic decline in catch followed almost immediately, with only 10 000 tonnes landed in 2009. Snoek catch has increased quite steadily since 1970 to 25 000 tonnes in 2009, with the exception of a single large catch of about 60 000 tonnes in 1978. The catch of oreo NEI maintained an average of 20 000 tonnes from the late 1970s to 2000. This has decreased slightly to an average of 16 000 tonnes in the last ten years. Catches of demersal percomorphs NEI fluctuated in the 1970s and experienced a continuous decline after reaching a peak of about 35 000 tonnes in 1982. 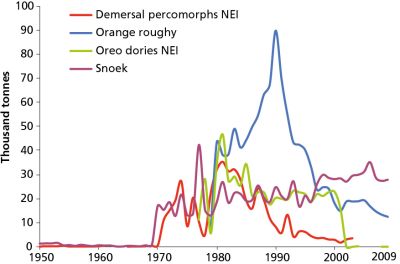 | | Figure B14.5 Annual nominal catches of selected species in ISSCAAP Group 34, Southwest Pacific (Area 81) |
Wellington flying squid and various squids NEI sustain the highest catches of ISSCAAP Group 57. They make the third-largest contribution to catches in Area 81. The landings of Wellington flying squid have varied greatly between 20 000 tonnes and 100 000 tonnes, and were about 50 000 tonnes in 2009 (Figure B14.6). In contrast, the catch of various squids NEI have fluctuated widely since recording began. However, they have declined overall from a peak of 70 000 tonnes in 1980 to 20 000 tonnes in 2009. The catch of greenback horse mackerel is the largest among the species in ISSCAAP Group 37. Its total catch was quite high between 1985 and 1990, with an average catch of 100 000 tonnes. 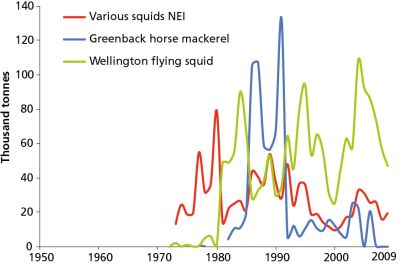 | | Figure B14.6 Annual nominal catches of selected species in ISSCAAP Group 57, Southwest Pacific (Area 81) |
Management Management unit: No South West Pacific (Area 81) has only two coastal countries, Australia and New Zealand. Most of the catch is taken by New Zealand fisheries as this region covers only a small portion of Australia’s EEZ. Other countries are mainly involved in high seas fishing in the region. Australia and New Zealand are often referred to as good examples in fisheries management. They have established clear fisheries policy and have fishery management plans for the long-term sustainability of fisheries in their EEZs. Each country undertakes assessments of the state of major fish stocks and its fisheries each year. Annual reports are published and available to the public on government Web sites. Both countries have implemented strong rightsbased fisheries management policies that are widely applied to a large number of stocks and species. This section reviews management issues separately for Australia and New Zealand, for the fisheries concerned by the major fish species presented in the Biological State and Trends section. The management issues of the fisheries for these species will be assessed separately for Australia and New Zealand. Further information on deepsea fisheries is given in the Chapter C3. AustraliaManagement of Australia’s fisheries is complex as there is a mix of responsibility between the commonwealth and state governments. The states manage all fisheries out to 3 nautical miles from shore and the commonwealth manages those beyond that to the 200-mile limit. State fisheries account for about 70 percent of total catches in Australia, and the commonwealth fisheries make up the remaining 30 percent (Partners, 2010).
The Government of Australia’s approach to fisheries management aims to “ensure that the exploitation of fisheries resources and the carrying on of any related activities are conducted in a manner consistent with the principles of ecologically sustainable development (ESD) and the exercise of the precautionary principle, in particular the need to have regard to the impact of fishing activities on non-target species and the long-term sustainability of the marine environment”, as required under the Fisheries Management Act 1991 (FMA).
The commonwealth fisheries are managed by the Australian Fisheries Management Authority (AFMA). The Government of Australia’s directions within the Commonwealth Fisheries Harvest Strategy: policy and guidelines (HSP; DAFF 2007) dictate that commonwealth fisheries need to be managed in both biological and economic terms. The HSP requires that harvest strategies be developed that pursue maximum economic yield for each commonwealth fishery (Wilson, Curtotti and Begg, 2010). Fish stock status and fishery economic state of commonwealth fisheries are reviewed and reported annually in the Fishery Status Reports.
The HSP provides a framework that allows a more strategic, science-based approach to setting fishery-by-fishery TAC levels in all commonwealth fisheries. A total of 101 stocks or species groups caught in commonwealth fisheries were assessed in 2009. These assessments had four tiers of assessment methods, including classic stock assessment and empirical indicator methods (Wilson, Curtotti and Begg, 2010).
Fisheries within three nautical miles of the coast are mostly managed by state and territory governments. In some fisheries, the states and commonwealth share the fisheries management responsibilities. This has resulted in state and territory governments managing fisheries that are partly within commonwealth waters under the terms of the Offshore Constitutional Settlement (Partners, 2010). Each state or territory has its own management plans for major fisheries and annual fishery status reports are published on its Web sites. New ZealandFisheries in New Zealand are managed under the Fisheries Act 1996, the purpose of which is “to provide for the utilization of fisheries resources while ensuring sustainability”. The Fisheries Act 1996 provides the legal framework for New Zealand’s world-leading quota management system (QMS) under which their fisheries are managed. Under the QMS, fishers can purchase and own quota for a particular fish stock. Each year, a TAC is set for each stock and the fishers are allocated an annual catch entitlement (ACE), which is a specific amount (in kilograms) of a species that the fishers is allowed to catch based on the proportion of the quota for that stock they own.
There are currently 100 species or species groups covered by the QMS. Each species or species group is split into quota management areas (QMAs) based on a combination of biological and administrative factors. The TACs and ACE are based on the QMAs for a particular species. The Fisheries Act 1996 requires that TACs “maintain the stock at or above a level that can produce the MSY, having regard to the interdependence of stocks”. The TACs are set using the best available scientific information. Each year, there is considerable investment in research and fisheries assessments. All research and assessments are carefully reviewed by expert scientists with active participation by fisheries managers and representatives of environmental and commercial fishing interests. The current status of fish stocks and biological information on species is reported in the report from the Fisheries Assessment Plenary each year. New Zealand approved a Harvest Strategy Standard in 2008 that describes best practice for the setting of fishery and stock targets and limits. The Harvest Strategy Standard provides guidance on how to develop species-specific targets and limits, and provides default values for targets and limits to establish a consistent and transparent framework for fisheries management decision-making.
In 2009, the Government of New Zealand developed a strategic direction document and goal for managing fisheries resources. Fisheries 2030 provides a long-term goal for the New Zealand fisheries sector that is: “New Zealanders maximizing benefits from the use of fisheries within environmental limits”. This goal is supported by two objectives: - Use – Fisheries resources are used in a manner that provides greatest overall
economic, social and cultural benefit. - Environment – The capacity and integrity of the aquatic environment, habitats and species are sustained at levels that provide for current and future use.
These outcomes are given effect through the development of five national fisheries plans. the national fisheries plans are five-year plans that establish the medium-term management approach through setting management objectives (and in some cases operational objectives). Once these management objectives have been achieved, they will contribute to the Fisheries 2030 goal and outcomes. National fisheries plans (MinFish, 2011a) are in place for highly migratory species and deep-water and middledepth species. Three plans covering inshore shellfish, finfish, and freshwater species are currently being finalized. Plans can be viewed on the Ministry of Fisheries Web site: www.fish.govt.nz.
In 2010, 14 stocks were considered to be overfished (below the soft limit of 20 percent B0): southern bluefin tuna (a highly migratory species over which New Zealand has limited management influence), three stocks of black cardinalfish, six stocks or substocks of orange roughy, and one stock or substock each of paua, rock lobster, scallop and snapper. Rebuilding programmes or TAC/total allowable commercial catch (TACC) reductions are in place in all these fisheries to allow them to rebuild to target levels (MinFish, 2011b).
Sources Marine and Inland Fisheries Service, Fisheries and Aquaculture Resources Use and Conservation Division. FAO Fisheries and Aquaculture Department “Review of the state of world marine fishery resources” FAO FISHERIES AND AQUACULTURE TECHNICAL PAPER. No. 569. Rome, FAO. 2011.  http://www.fao.org/docrep/015/i2389e/i2389e.pdf http://www.fao.org/docrep/015/i2389e/i2389e.pdf Bibliography The bibliographic references are available through the hyperlink displayed in "Source of Information". ACKNOWLEDGEMENTSMichelle Beritzhoff and James Brown from the Ministry of Fisheries, New Zealand and Ross Shotton, former FAO Fishery Resources Officer reviewed an earlier version of this chapter. Their valuable comments and suggestions greatly improved this paper. |
|
| |
|
|


