|
| Fact Sheet Title Fact Sheet |
| |
| Cod - Norwegian Sea, Spitzbergen, and Bear Island between 62°N and 67°N (coastal waters) |
 | Cod (Gadus morhua) in Subarea 2 between 62°N and 67°N (Norwegian Sea), southern Norwegian coastal cod |
| | Data Ownership | | This document provided, maintained and owned by International Council for the Exploration of the Sea (ICES) , is part of ICES Advice data collection. |
|
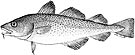
| ident Block | ident Block | | | | Species List: | | Species Ref: en - Atlantic cod, fr - Morue de l'Atlantique, es - Bacalao del Atlántico, zh - 大西洋鳕, ru - Треска атлантическая |
Fishery IndicatorsProduction: Landed Volume |
|
| ident Block Cod - Norwegian Sea, Spitzbergen, and Bear Island between 62°N and 67°N (coastal waters)
Map tips
- Click on
 to turn layers on and off to turn layers on and off
- Double-click to zoom in
- Drag to pan
- Hold down the shift key and drag to zoom to a particular region
| fao Sub Area |
|---|
| 27.2 | Norwegian Sea, Spitzbergen, and Bear Island (Subarea 27.2) |
|---|
|
|
|
|
|
| Aq Res | Biological Stock: Yes
Value: Sub-Regional
Reference year: 2021 |
| Considered a management unit: An aquatic resource or fishery is
declared as [Fishery] Management Unit if it is
effectively the focus for the application of selected
management methods and measures, within the broader
framework of a management system. According to the FAO
Glossary for Responsible Fishing, "a Fishery Management
Unit (FMU) is a fishery or a portion of a fishery
identified in a Fishery Management Plan (FMP) relevant
to the FMP's management objectives." FMU's may be
organised around fisheries biological, geographic,
economic, technical, social or ecological dimensions ,
and the makeup and attribute of a fishery management
unit depends mainly on the FMP's management
objectives. |
| Jurisdictional distribution: Jurisdictional qualifier (e.g.
"shared", "shared - highly migratory") of the aquatic
resource related with its spatial distribution. |
| Environmental group: Classification of the aquatic
resource according to the environmental group (e.g.
pelagic invertebrate, or demersal fish) to which the
species belong. |
| Reference Year: The Reference Year is the last year considered in the stock assessment and/or fishery status. |
| | | | | | Water Area Overview Spatial Scale: Sub-Regional Water Area Overview  | | Water Area Overview Cod - Norwegian Sea, Spitzbergen, and Bear Island between 62°N and 67°N (coastal waters)
| fao Sub Area | 27.2: Norwegian Sea, Spitzbergen, and Bear Island (Subarea 27.2) |
| | | | | | Water Area Overview |
Water Area OverviewCod - Norwegian Sea, Spitzbergen, and Bear Island between 62°N and 67°N (coastal waters) | fao Major | 27:
Atlantic, Northeast | | Large Marine Ecosystem Areas (LME) | 19: East Greenland Shelf | | 20: Barents Sea | | 21: Norwegian Shelf | | 22: North Sea | | 59: East Greenland Shelf/Sea | | 60: Faroe Plateau | | 64: Arctic Ocean |
Aq Res Struct Biological Stock: Yes Exploit Fishery Indicators | Type | Measure | Value | Unit | Time period |
|---|
| Production | Landed Volume | 3696 | tonnes | 2021 | | Landed Volume | 3481 | tonnes | 2020 | | Landed Volume | 2965.14 | tonnes | 2019 | | Landed Volume | 4436.431 | tonnes | 2018 | | Landed Volume | 4159.45 | tonnes | 2017 | | Landed Volume | 5961.625 | tonnes | 2016 | | Landed Volume | 5004.241 | tonnes | 2015 | | Landed Volume | 6244.443 | tonnes | 2014 | | Landed Volume | 5130.939 | tonnes | 2013 | | Landed Volume | 8186.512 | tonnes | 2012 | | Landed Volume | 7127.787 | tonnes | 2011 | | Landed Volume | 7633.681 | tonnes | 2010 | | Landed Volume | 7144.861 | tonnes | 2009 | | Landed Volume | 9889.206 | tonnes | 2008 | | Landed Volume | 7695.261 | tonnes | 2007 | | Landed Volume | 8611.842 | tonnes | 2006 | | Landed Volume | 8004.899 | tonnes | 2005 | | Landed Volume | 6866.057 | tonnes | 2004 | | Landed Volume | 8905.234 | tonnes | 2003 | | Landed Volume | 6936.991 | tonnes | 2002 | | Landed Volume | 5250 | tonnes | 2001 | | Landed Volume | 5838.441 | tonnes | 2000 | | Landed Volume | 5522.145 | tonnes | 1999 | | Landed Volume | 6200.357 | tonnes | 1998 | | Landed Volume | 4745.895 | tonnes | 1997 | | Landed Volume | 6207.098 | tonnes | 1996 | | Landed Volume | 8936.072 | tonnes | 1995 | | Landed Volume | 6380.741 | tonnes | 1994 | | Landed Volume | 6202 | tonnes | 1993 | | Landed Volume | 3923 | tonnes | 1992 | | Landed Volume | 3823 | tonnes | 1991 | | Landed Volume | 3687 | tonnes | 1990 | | Landed Volume | 6993 | tonnes | 1989 | | Landed Volume | 5153 | tonnes | 1988 | | Landed Volume | 5147 | tonnes | 1987 | | Landed Volume | 3319 | tonnes | 1986 | | Landed Volume | 7424 | tonnes | 1985 | | Landed Volume | 5621 | tonnes | 1984 | | Landed Volume | 5562 | tonnes | 1983 | | Landed Volume | 5883 | tonnes | 1982 | | Landed Volume | 10117 | tonnes | 1981 | | Landed Volume | 8923 | tonnes | 1980 | | Landed Volume | 8194 | tonnes | 1979 | | Landed Volume | 6272 | tonnes | 1978 | | Landed Volume | 9776 | tonnes | 1977 |
Bio Assess Assess Empirical Approach Type: CPUE based trend assessment Sources ICES. 2023. Stock Information Database. Stock Details (cod.27.2.coastS).  https://sid.ices.dk/ViewStock.aspx?key=3444 https://sid.ices.dk/ViewStock.aspx?key=3444ICES Advice accessed through ICES Stock Assessment Database in 2023. ICES, Copenhagen. https://standardgraphs.ices.dk/ViewCharts.aspx?key=17129 Bibliography All references to figures, tables and bibliography in the text are found within the source of information. |
|
| |
|