|
| Fact Sheet Title Fact Sheet |
| |
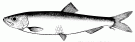
 | Sprat (Sprattus sprattus) in Subarea 4 (North Sea) |
| | Data Ownership | | This document provided, maintained and owned by International Council for the Exploration of the Sea (ICES) , is part of ICES Advice data collection. |
|
| ident Block | ident Block | | | | Species List: | | Species Ref: en - European sprat, fr - Sprat, es - Espadín, ru - Шпрот европейский |
Fishery IndicatorsProduction: Landed Volume; Catch |
|
| ident Block Sprat - North Sea Map tips - Click on
 to turn layers on and off to turn layers on and off - Double-click to zoom in
- Drag to pan
- Hold down the shift key and drag to zoom to a particular region
| fao Sub Area |
|---|
| 27.4 | North Sea (Subarea 27.4) |
|---|
|
|
|
|
|
| Aq Res | Biological Stock: Yes Value: Sub-Regional
Management unit: Yes Reference year: 2017
|
| Considered a management unit: An aquatic resource or fishery is declared as [Fishery] Management Unit if it is effectively the focus for the application of selected management methods and measures, within the broader framework of a management system. According to the FAO Glossary for Responsible Fishing, "a Fishery Management Unit (FMU) is a fishery or a portion of a fishery identified in a Fishery Management Plan (FMP) relevant to the FMP's management objectives." FMU's may be organised around fisheries biological, geographic, economic, technical, social or ecological dimensions , and the makeup and attribute of a fishery management unit depends mainly on the FMP's management objectives. |
| Jurisdictional distribution: Jurisdictional qualifier (e.g. "shared", "shared - highly migratory") of the aquatic resource related with its spatial distribution. |
| Environmental group: Classification of the aquatic resource according to the environmental group (e.g. pelagic invertebrate, or demersal fish) to which the species belong. |
| Reference Year: The Reference Year is the last year considered in the stock assessment and/or fishery status. |
| | | | | | Habitat Bio Depth Zone: Shelf (50 m - 200 m). Vertical Dist: Pelagic. Water Area Overview Spatial Scale: Sub-Regional Water Area Overview  | | Water Area Overview Sprat - North Sea
| fao Sub Area | 27.4: North Sea (Subarea 27.4) |
| | | | | | Water Area Overview |
Water Area OverviewSprat - North Sea Aq Res Struct Biological Stock: Yes Exploit Fishery Indicators | Type | Measure | Value | Unit | Time period |
|---|
| Production | Landed Volume | 379747 | tonnes | 1974 | | Landed Volume | 637282 | tonnes | 1975 | | Landed Volume | 557359 | tonnes | 1976 | | Landed Volume | 318769 | tonnes | 1977 | | Landed Volume | 378632 | tonnes | 1978 | | Landed Volume | 368667 | tonnes | 1979 | | Landed Volume | 300239 | tonnes | 1980 | | Landed Volume | 203897 | tonnes | 1981 | | Landed Volume | 123379 | tonnes | 1982 | | Landed Volume | 85168 | tonnes | 1983 | | Landed Volume | 85617 | tonnes | 1984 | | Landed Volume | 40921 | tonnes | 1985 | | Landed Volume | 15687 | tonnes | 1986 | | Landed Volume | 37551 | tonnes | 1987 | | Landed Volume | 95972 | tonnes | 1988 | | Landed Volume | 51943 | tonnes | 1989 | | Landed Volume | 67386 | tonnes | 1990 | | Landed Volume | 114872 | tonnes | 1991 | | Landed Volume | 148236 | tonnes | 1992 | | Landed Volume | 209193 | tonnes | 1993 | | Landed Volume | 313687 | tonnes | 1994 | | Landed Volume | 387626 | tonnes | 1995 | | Landed Volume | 84573 | tonnes | 1996 | | Landed Volume | 104797 | tonnes | 1997 | | Landed Volume | 172063 | tonnes | 1998 | | Landed Volume | 215412 | tonnes | 1999 | | Landed Volume | 195170 | tonnes | 2000 | | Landed Volume | 131538 | tonnes | 2001 | | Landed Volume | 157248 | tonnes | 2002 | | Landed Volume | 159515 | tonnes | 2003 | | Landed Volume | 207779 | tonnes | 2004 | | Landed Volume | 232048 | tonnes | 2005 | | Landed Volume | 74648 | tonnes | 2006 | | Landed Volume | 85080 | tonnes | 2007 | | Landed Volume | 63623 | tonnes | 2008 | | Landed Volume | 162714 | tonnes | 2009 | | Landed Volume | 126077 | tonnes | 2010 | | Landed Volume | 119083 | tonnes | 2011 | | Landed Volume | 86196 | tonnes | 2012 | | Landed Volume | 81268 | tonnes | 2013 | | Landed Volume | 192679 | tonnes | 2014 | | Landed Volume | 286086 | tonnes | 2015 | | Landed Volume | 225537 | tonnes | 2016 | | Landed Volume | 139623 | tonnes | 2017 |
Fishery Indicators | Type | Measure | Value | Unit | Time period |
|---|
| Production | Catch | 379747 | tonnes | 1974 | | Catch | 637282 | tonnes | 1975 | | Catch | 557359 | tonnes | 1976 | | Catch | 318769 | tonnes | 1977 | | Catch | 378632 | tonnes | 1978 | | Catch | 368667 | tonnes | 1979 | | Catch | 300239 | tonnes | 1980 | | Catch | 203897 | tonnes | 1981 | | Catch | 123379 | tonnes | 1982 | | Catch | 85168 | tonnes | 1983 | | Catch | 85617 | tonnes | 1984 | | Catch | 40921 | tonnes | 1985 | | Catch | 15687 | tonnes | 1986 | | Catch | 37551 | tonnes | 1987 | | Catch | 95972 | tonnes | 1988 | | Catch | 51943 | tonnes | 1989 | | Catch | 67386 | tonnes | 1990 | | Catch | 114872 | tonnes | 1991 | | Catch | 148236 | tonnes | 1992 | | Catch | 209193 | tonnes | 1993 | | Catch | 313687 | tonnes | 1994 | | Catch | 387626 | tonnes | 1995 | | Catch | 84573 | tonnes | 1996 | | Catch | 104797 | tonnes | 1997 | | Catch | 172063 | tonnes | 1998 | | Catch | 215412 | tonnes | 1999 | | Catch | 195170 | tonnes | 2000 | | Catch | 131538 | tonnes | 2001 | | Catch | 157248 | tonnes | 2002 | | Catch | 159515 | tonnes | 2003 | | Catch | 207779 | tonnes | 2004 | | Catch | 232048 | tonnes | 2005 | | Catch | 74648 | tonnes | 2006 | | Catch | 85080 | tonnes | 2007 | | Catch | 63623 | tonnes | 2008 | | Catch | 162714 | tonnes | 2009 | | Catch | 126077 | tonnes | 2010 | | Catch | 119083 | tonnes | 2011 | | Catch | 86196 | tonnes | 2012 | | Catch | 81268 | tonnes | 2013 | | Catch | 192679 | tonnes | 2014 | | Catch | 286086 | tonnes | 2015 | | Catch | 225537 | tonnes | 2016 | | Catch | 139623 | tonnes | 2017 |
Management Management unit: Yes Sources ICES Advice accessed through ICES Stock Assessment Database in 2019. ICES, Copenhagen.  http://standardgraphs.ices.dk/ViewCharts.aspx?key=9305 http://standardgraphs.ices.dk/ViewCharts.aspx?key=9305 |
|
| |
|