Economic Performance
5.4.3 National fleet economic performanceThe total amount of income generated by the Danish national fleet in 2010 was €405 million. This consisted of €387 million from landings, €17 million in other income and €70 thousand in direct incomesubsidies (Table 5.4.2). The total income of the Danish fleet increased 38% between 2009 and 2010. Total operating costs of the Danish national fleet in 2010 were €190 million, amounting to 47% of total income. The largest expenditure items were crew wages (€79 million) and fuel costs (€45 million) (Table 5.4.2). In 2010, total operating costs were 2.3% lower than in 2008, however they were 14% higher than in 2009.
In terms of profitability, the total amount of GVA, gross profit and net profit (excluding subsidies) generated by the Danish national fleet in 2010 was €267 million, €176 million and €58 million, respectively (Table 5.4.2, fig. 5.4.5). These results appear to buck a trend of indicated net profit losses generated by the fleet in 2008 and 2009. In 2010, the Danish fleet had an estimated depreciated replacement value of €442 million and an estimated value of fishing rights of €740 million.
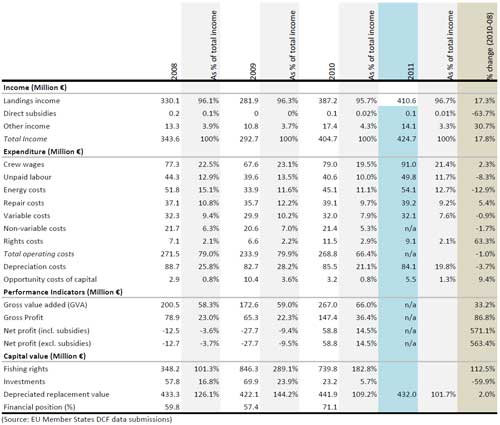 |
Table 5.4.2 Denmark national fishing fleet economic performance indicators: 2008-2011. Forecast figures for 2011 are highlighted in blue and values are also presented as a percentage of total income (shaded grey columns) Source: EU Member States DCF data submissions  |
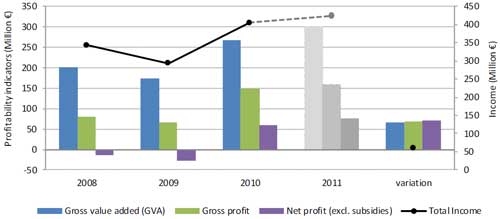 |
| Figure 5.4.5 Denmark national fishing fleet economic performance trends: 2008-2011 Source: EU Member States DCF data submissions |
5.4.4 Fleet composition The Danish national fleet consisted of 18 fleet segments in 2010. The fleet is highly diversified with abroad range of vessel types targeting different species predominantly in the North Sea, Baltic Sea andNorth Atlantic. Table 5.5.3 provides a breakdown of key performance indicators for all Danish fleetsegments in 2010. A short description of the five most important segments in terms of total value oflandings is provided below.
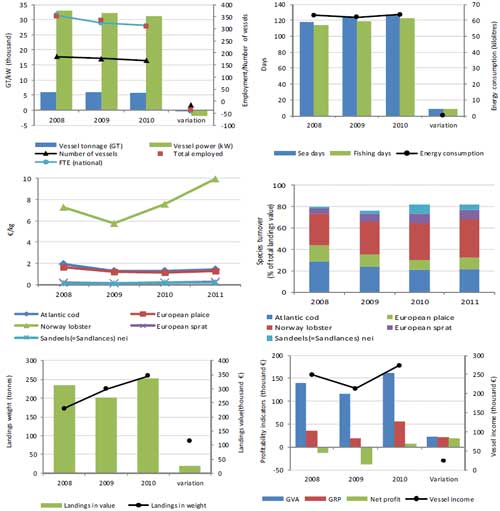
Beam trawl 12-18m (TBB: VL1218) - 11 vessels make up this segment and are based predominantly inthe Baltic Sea. These vessels target demersal species such as common shrimp, plaice and cod. The totalvalue of landings was around €31 million and around 20 FTEs were employed in this fleet segment in2010. This fleet segment was profitable in 2010, with a GVA of €13 million and a net profit of over €220thousand. The average vessel income was estimated at €217 thousand, generating a gross profit of€20thousand and net loss of €24 thousand in 2010 (fig. 5.4.6).
Demersal trawl / seine 12-18m (DTS: VL1218) - 168 vessels make up this segment and are basedpredominantly in the North and Baltic Seas. These vessels target demersal species such as cod, haddockand saithe. The total value of landings was around €43 million and around 313 FTEs were employed inthis fleet segment in 2010. This fleet segment was profitable in 2010, with a GVA of €27 million and anet profit of over €1 million. The average vessel in this fleet segment achieved an income of €274thousand in 2010, generating a gross profit of €56 thousand and net profit of € 6.3 thousand (fig. 5.4.7).
Demersal trawl / seine 18-24m (DTS: VL1824) - 68 vessels make up this segment and are basedpredominantly in the North Sea and Skagerrak. These vessels target demersal species such as cod,Norway lobster, plaice and sole. The total value of landings was around €44 million and around 274 FTEswere employed in this fleet segment in 2010. This fleet segment was profitable in 2010, with a GVA of€27 million and a net profit of around €0.9 million.
Demersal trawl / seine 24-40m (DTS: VL2440) - 42 vessels make up this segment and are basedpredominantly in the North Sea and Skagerrak. These vessels target demersal species such as cod,sandeel and saithe. The total value of landings was around €57 million and around 254 FTEs wereemployed in this fleet segment in 2010. This fleet segment was highly profitable in 2010, with a GVA of€36 million and a net profit of over €6 million.
Demersal trawl / seine above 40m (DTS: VL40XX) - 29 vessels make up this segment and are basedpredominantly in the North Sea and in the North Atlantic. These vessels target demersal species such assandeel, mackerel, sprat and herring. The total value of landings was around €163 million and around313 FTEs were employed in this fleet segment in 2010. This fleet segment was profitable in 2010, with aGVA of €133 million and a net profit of over €59 million.
Vessels using polyvalent passive gears 12-18m (PGP: VL1218) - 45 vessels make up this segment andare based predominantly in the North Sea and Skagerrak. These vessels target demersal species such ascod, sole and plaice. The total value of landings was around €14 million and around 89 FTEs wereemployed in this fleet segment in 2010. This fleet segment was stable in 2010, with a GVA of €7 millionand a net profit of over €-0.1 million.
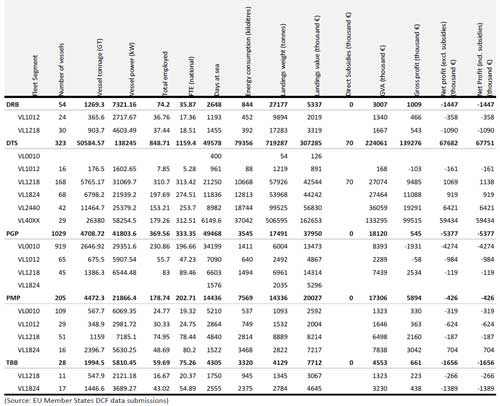 |
| Table 5.4.3 Denmark national fishing fleet composition and key indicators at fleet segment level for 2010. Source: EU Member States DCF data submissions |
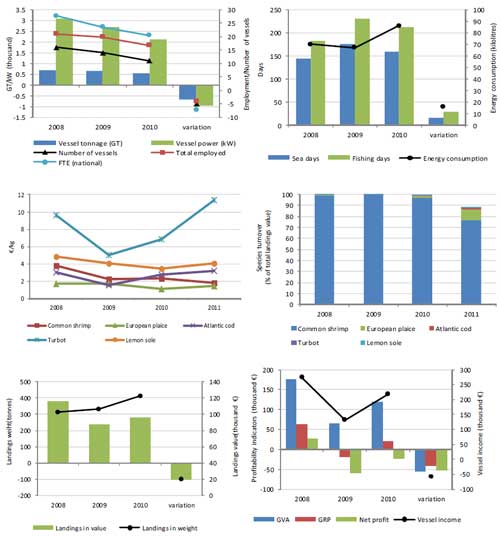 |
| Figure 5.4.6 Key indicators for the average vessel in the Denmark TBB VL1218 fleet segment 2008-2011 top left – fleet segment capacity and employment; top right – average fishing activity and effort; middle left – average prices (€/kg) for key species; middle right - turnover as a percentage of total value of landings for key species; bottom left – average landings in value and weight: bottom right – main economic performance indicators for the average vessel (variation 2010-2008) Source: EU Member States DCF data submissions |
 |
| Figure 5.4.7 Key indicators for the average vessel in the Denmark DTS VL1218 fleet segment 2008-2011 top left – fleet segment capacity and employment; top right – average fishing activity and effort; middle left – average prices (€/kg) for key species; middle right - turnover as a percentage of total value of landings for key species; bottom left – average landings in value and weight: bottom right – main economic performance indicators for the average vessel (variation 2010-2008) Source: EU Member States DCF data submissions |
Projection
5.4.5 Assessment for 2011 and 2012Based on landings value for 2011, the Danish fishery had an increase in landings value compared to 2010. Higher prices on some of the most important species such as cod, mackerel, herring, sprat andNorway lobster in most cases outweighed the fall in total weight of landings. Combined with a continuedrestructuring of the fleet, this is expected to result in a better economic performance in 2011 comparedto 2010.
Looking at the outlook for 2012, things do not look so positive. A very low TAC for sandeel will have amajor impact on the economic performance of many vessels. Furthermore, the uncertain situation withthe mackerel stock in the North Atlantic, and the on‐going discussions with Iceland and the FaeroeseIslands may also have an impact on the performance of the demersal trawl/seine above 40m. Negativedevelopments are expected in price for most of the species caught by Danish fishermen. In summary,the economic performance in 2012 is expected to be worse than 2011.


