|
| Fact Sheet Title Fact Sheet |
| |
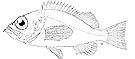
| Beaked redfish - Iceland and Faroe grounds, North of Azores, East Greenland and Northwest Atlantic (upper slope) |
 | Beaked redfish (Sebastes mentella) in ICES Subareas 5, 12, and 14 (Iceland and Faroe grounds, North of Azores, East of Greenland) and NAFO Subareas 1 and 2 (shallow pelagic stock < 500 m) |
| | Data Ownership | | This document provided, maintained and owned by International Council for the Exploration of the Sea (ICES) , is part of ICES Advice data collection. |
|
| ident Block | ident Block | | | | Species List: | | Species Ref: en - Beaked redfish, fr - Sébaste du Nord, es - Gallineta nórdica, ru - Клювач |
Fishery IndicatorsProduction: Landed Volume; Catch |
|
| ident Block Beaked redfish - Iceland and Faroe grounds, North of Azores, East Greenland and Northwest Atlantic (upper slope) Map tips - Click on
 to turn layers on and off to turn layers on and off - Double-click to zoom in
- Drag to pan
- Hold down the shift key and drag to zoom to a particular region
| fao Sub Area |
|---|
| 21.1 | Atlantic, Northwest / 21.1 |
|---|
| 21.2 | Atlantic, Northwest / 21.2 |
|---|
| 27.5 | Iceland and Faroes Grounds (Subarea 27.5) |
|---|
| 27.12 | North of Azores (Subarea 27.12) |
|---|
| 27.14 | East Greenland (Subarea 27.14) |
|---|
|
|
|
|
|
| Aq Res | Biological Stock: Yes Value: Sub-Regional
Management unit: Yes Reference year: 2015
|
| Considered a management unit: An aquatic resource or fishery is declared as [Fishery] Management Unit if it is effectively the focus for the application of selected management methods and measures, within the broader framework of a management system. According to the FAO Glossary for Responsible Fishing, "a Fishery Management Unit (FMU) is a fishery or a portion of a fishery identified in a Fishery Management Plan (FMP) relevant to the FMP's management objectives." FMU's may be organised around fisheries biological, geographic, economic, technical, social or ecological dimensions , and the makeup and attribute of a fishery management unit depends mainly on the FMP's management objectives. |
| Jurisdictional distribution: Jurisdictional qualifier (e.g. "shared", "shared - highly migratory") of the aquatic resource related with its spatial distribution. |
| Environmental group: Classification of the aquatic resource according to the environmental group (e.g. pelagic invertebrate, or demersal fish) to which the species belong. |
| Reference Year: The Reference Year is the last year considered in the stock assessment and/or fishery status. |
| | | | | | Habitat Bio Depth Zone: Slope - Upperslope (200 m - 500 m). Vertical Dist: Pelagic. Water Area Overview Spatial Scale: Sub-Regional Water Area Overview  | | Water Area Overview Beaked redfish - Iceland and Faroe grounds, North of Azores, East Greenland and Northwest Atlantic (upper slope)
| fao Sub Area | 21.1: Atlantic, Northwest / 21.1 | | 21.2: Atlantic, Northwest / 21.2 | | 27.12: North of Azores (Subarea 27.12) | | 27.14: East Greenland (Subarea 27.14) | | 27.5: Iceland and Faroes Grounds (Subarea 27.5) |
| | | | | | Water Area Overview |
Water Area OverviewBeaked redfish - Iceland and Faroe grounds, North of Azores, East Greenland and Northwest Atlantic (upper slope) Aq Res Struct Biological Stock: Yes Exploit Fishery Indicators | Type | Measure | Value | Unit | Time period |
|---|
| Production | Landed Volume | 60581 | tonnes | 1982 | | Landed Volume | 60234 | tonnes | 1983 | | Landed Volume | 64832 | tonnes | 1984 | | Landed Volume | 71671 | tonnes | 1985 | | Landed Volume | 105107 | tonnes | 1986 | | Landed Volume | 91169 | tonnes | 1987 | | Landed Volume | 91419 | tonnes | 1988 | | Landed Volume | 38784 | tonnes | 1989 | | Landed Volume | 31901 | tonnes | 1990 | | Landed Volume | 27179 | tonnes | 1991 | | Landed Volume | 62564 | tonnes | 1992 | | Landed Volume | 100771 | tonnes | 1993 | | Landed Volume | 96869 | tonnes | 1994 | | Landed Volume | 100136 | tonnes | 1995 | | Landed Volume | 41770 | tonnes | 1996 | | Landed Volume | 27746 | tonnes | 1997 | | Landed Volume | 24150 | tonnes | 1998 | | Landed Volume | 25512 | tonnes | 1999 | | Landed Volume | 33216 | tonnes | 2000 | | Landed Volume | 41825 | tonnes | 2001 | | Landed Volume | 43216 | tonnes | 2002 | | Landed Volume | 56688 | tonnes | 2003 | | Landed Volume | 33951 | tonnes | 2004 | | Landed Volume | 28229 | tonnes | 2005 | | Landed Volume | 15734 | tonnes | 2006 | | Landed Volume | 6126 | tonnes | 2007 | | Landed Volume | 2059 | tonnes | 2008 | | Landed Volume | 2380 | tonnes | 2009 | | Landed Volume | 2198 | tonnes | 2010 | | Landed Volume | 234 | tonnes | 2011 | | Landed Volume | 3173 | tonnes | 2012 | | Landed Volume | 1529 | tonnes | 2013 | | Landed Volume | 6423 | tonnes | 2014 | | Landed Volume | 5595 | tonnes | 2015 |
Fishery Indicators | Type | Measure | Value | Unit | Time period |
|---|
| Production | Catch | 60581 | tonnes | 1982 | | Catch | 60234 | tonnes | 1983 | | Catch | 64832 | tonnes | 1984 | | Catch | 71671 | tonnes | 1985 | | Catch | 105107 | tonnes | 1986 | | Catch | 91169 | tonnes | 1987 | | Catch | 91419 | tonnes | 1988 | | Catch | 38784 | tonnes | 1989 | | Catch | 31901 | tonnes | 1990 | | Catch | 27179 | tonnes | 1991 | | Catch | 62564 | tonnes | 1992 | | Catch | 100771 | tonnes | 1993 | | Catch | 96869 | tonnes | 1994 | | Catch | 100136 | tonnes | 1995 | | Catch | 41770 | tonnes | 1996 | | Catch | 27746 | tonnes | 1997 | | Catch | 24150 | tonnes | 1998 | | Catch | 25512 | tonnes | 1999 | | Catch | 33216 | tonnes | 2000 | | Catch | 41825 | tonnes | 2001 | | Catch | 43216 | tonnes | 2002 | | Catch | 56688 | tonnes | 2003 | | Catch | 33951 | tonnes | 2004 | | Catch | 28229 | tonnes | 2005 | | Catch | 15734 | tonnes | 2006 | | Catch | 6126 | tonnes | 2007 | | Catch | 2059 | tonnes | 2008 | | Catch | 2380 | tonnes | 2009 | | Catch | 2198 | tonnes | 2010 | | Catch | 234 | tonnes | 2011 | | Catch | 3173 | tonnes | 2012 | | Catch | 1529 | tonnes | 2013 | | Catch | 6423 | tonnes | 2014 | | Catch | 5595 | tonnes | 2015 |
Management Management unit: Yes Sources ICES Advice accessed through ICES Stock Assessment Database on March 2018. ICES, Copenhagen.  http://standardgraphs.ices.dk/ViewCharts.aspx?key=7861 http://standardgraphs.ices.dk/ViewCharts.aspx?key=7861 |
|
| |
|