Blue shark - North Atlantic|
| Fact Sheet Title Fact Sheet |
| | | Blue shark - North Atlantic |
| | Data Ownership | | This document owned by International Commission for the Conservation of Atlantic Tunas (ICCAT), provided and maintained by Standing Committee on Research and Statistics , is part of ICCAT SCRS Reports data collection. |
| | ident Block | ident Block | | | | Species List: | | Species Ref: en - Blue shark, fr - Peau bleue, es - Tiburón azul, ru - Акула синяя |
|
|
| ident Block Blue shark - North Atlantic Map tips - Click on
 to turn layers on and off to turn layers on and off - Double-click to zoom in
- Drag to pan
- Hold down the shift key and drag to zoom to a particular region
| fao Major |
|---|
| 21 | Atlantic, Northwest |
|---|
| 27 | Atlantic, Northeast |
|---|
| 31 | Atlantic, Western Central |
|---|
| fao Sub Area |
|---|
| 34.1 | Northern coastal subarea |
|---|
| 34.2 | Northern oceanic subarea |
|---|
| fao Div |
|---|
| 34.3.1 | Cape Verde coastal |
|---|
| 34.3.2 | Cape Verde insular |
|---|
| 34.3.3 | Sherbro |
|---|
| 34.3.4 | Western Gulf of Guinea |
|---|
| 34.3.5 | Central Gulf of Guinea |
|---|
| 34.4.2 | Southwest oceanic |
|---|
|
|
|
|
| | Aq Res | Biological Stock: Yes Value: Sub-Regional
Management unit: Yes Reference year: 2013
|
| Considered a management unit: An aquatic resource or fishery is declared as [Fishery] Management Unit if it is effectively the focus for the application of selected management methods and measures, within the broader framework of a management system. According to the FAO Glossary for Responsible Fishing, "a Fishery Management Unit (FMU) is a fishery or a portion of a fishery identified in a Fishery Management Plan (FMP) relevant to the FMP's management objectives." FMU's may be organised around fisheries biological, geographic, economic, technical, social or ecological dimensions , and the makeup and attribute of a fishery management unit depends mainly on the FMP's management objectives. |
| Jurisdictional distribution: Jurisdictional qualifier (e.g. "shared", "shared - highly migratory") of the aquatic resource related with its spatial distribution. |
| Environmental group: Classification of the aquatic resource according to the environmental group (e.g. pelagic invertebrate, or demersal fish) to which the species belong. |
| Reference Year: The Reference Year is the last year considered in the stock assessment and/or fishery status. |
| | | | | | History In response to the Supplemental Recommendation by ICCAT Concerning the Conservation of Sharks Caught in Association with Fisheries Managed by ICCAT [Rec. 06-10], an updated assessment of the stocks of blue shark ( Prionace glauca) and shortfin mako ( Isurus oxyrinchus) was conducted in 2008. Ecological risk assessments (ERA) were also conducted for nine additional priority species of pelagic elasmobranchs, for which available data are very limited ( Isurus paucus, Alopias superciliosus, Alopias vulpinus, Carcharhinus longimanus, C. falciformis, Lamna nasus, Sphyrna lewini, Sphyrna zygaena, and Pteroplatytrygon violacea). The quantity and quality of the data available (e.g., historical catches and CPUE information) to conduct stock assessments have increased with respect to those available in the first (2004) shark assessments (Anon. 2005c) conducted by ICCAT. However, they are still quite uninformative and do not provide a consistent signal to inform the assessment. It was noted that considerable progress was made on the integration of new data sources, in particular size data, and modelling approaches, particularly model structure, in the 2015 assessment of the status of the stock of North Atlantic blue shark. Uncertainty in data inputs and model configuration was explored through sensitivity analysis. Although sensitivity analyses did not cover the full range of possible uncertainty, they revealed that results were sensitive to structural assumptions of the models. Although significant progress has been made, unless these uncertainties and other issues can be resolved, the assessments of stock status for all pelagic shark species will continue to be very uncertain and our ability to detect stock depletion to levels below the Convention Objective level will remain considerably low. A summary of the Committee’s findings based on the 2015 (Anon. 2015c) assessment results is presented below. Although pelagic sharks are captured in the Atlantic Ocean with a wide variety of fishing gears, the largest volume of most of the species of major concern to ICCAT are captured by pelagic longline fisheries. The Committee assessed blue sharks in 2015 assuming the existence of three separate stocks: North, South and Mediterranean. However, the data available to the Committee for the Mediterranean were not considered sufficient to conduct quantitative assessments for these species. The assessment results presented high levels of uncertainty due to data limitations. Increased research and data collection are required to enable the Committee to improve the advice it can offer. Habitat Bio Climatic Zone: Tropical; Temperate. Horizontal Dist: Oceanic. Vertical Dist: Pelagic. A great variety of shark species are found within the ICCAT Convention area, from coastal to oceanic species. Biological strategies of these sharks are very diverse and are adapted to the needs within their respective ecosystems where they occupy a very high position in the trophic chain as active predators. Therefore, generalization as regards to the biology of these very diverse species results in inevitable inaccuracies, as would occur for teleosts. To date, ICCAT has prioritized the biological study and assessment of the major sharks of the epipelagic system as these species are more susceptible of being caught as by-catch by oceanic fleets targeting tuna and tuna-like species. Among these shark species there are some of special prevalence and with an extensive geographical distribution within the oceanic-epipelagic ecosystem, such as the blue shark and shortfin mako shark, and others with less or even limited prevalence, such as porbeagle, hammerhead sharks, thresher sharks, white sharks, etc. Blue shark shows a wide geographical distribution, most often between 50ºN and 50ºS latitude. This species have an ovoviviparous reproductive strategy, which increases the probability of survival of their young, with abundant litters of about 40 pups in the case of blue shark. Their growth rates differ between sexes and among species. Females often reach first maturity at a large size. A characteristic of this species is usually its tendency to segregate temporally and spatially by size-sex, according to its respective processes of feeding, mating-reproduction, gestation and birth. Numerous aspects of the biology of this species are still poorly understood or completely unknown, particularly for some regions, which contributes to increased uncertainty in quantitative and qualitative assessments. Geo Dist Geo Dist: Highly migratory Blue shark shows a wide geographical distribution, most often between 50ºN and 50ºS latitude. Water Area Overview Spatial Scale: Sub-Regional Water Area Overview  | | Water Area Overview Blue shark - North Atlantic
| fao Div | 34.3.1: Cape Verde coastal | | 34.3.2: Cape Verde insular | | 34.3.3: Sherbro | | 34.3.4: Western Gulf of Guinea | | 34.3.5: Central Gulf of Guinea | | 34.4.2: Southwest oceanic | | fao Major | 21: Atlantic, Northwest | | 27: Atlantic, Northeast | | 31: Atlantic, Western Central | | fao Sub Area | 34.1: Northern coastal subarea | | 34.2: Northern oceanic subarea |
| | | | | | Water Area Overview |
Water Area OverviewBlue shark - North Atlantic | fao Major | 21: Atlantic, Northwest | | 27: Atlantic, Northeast | | 31: Atlantic, Western Central | | 34: Atlantic, Eastern Central | | Large Marine Ecosystem Areas (LME) | 5: Gulf of Mexico | | 6: Southeast U.S. Continental Shelf | | 7: Northeast U.S. Continental Sh | | 8: Scotian Shelf | | 9: Newfoundland-Labrador Shelf | | 12: Caribbean Sea | | 17: North Brazil Shelf | | 18: West Greenland Shelf | | 19: East Greenland Shelf | | 20: Barents Sea | | 22: North Sea | | 23: Baltic Sea | | 24: Celtic-Biscay Shelf | | 25: Iberian Coastal | | 58: Kara Sea | | 59: East Greenland Shelf/Sea | | 60: Faroe Plateau | | 63: Hudson Bay | | 64: Arctic Ocean | | 65: Arctic Archipelago | | 66: Baffin Bay/Davis Straight |
Aq Res Struct Biological Stock: Yes The Committee assessed blue sharks in 2015 assuming the existence of three separate stocks: North, South and Mediterranean. However, the data available to the Committee for the Mediterranean were not considered sufficient to conduct quantitative assessments for these species. The assessment results presented high levels of uncertainty due to data limitations and model structural issues. Exploit Fishery Indicators Earlier reviews of the shark database resulted in recommendations to improve data reporting on shark catches. Though global statistics on shark catches included in the database have improved, they are still insufficient to permit the Committee to provide quantitative advice on stock status with sufficient precision to guide fishery management toward optimal harvest levels. Reported catches for blue shark, shortfin mako and porbeagle are provided in Table 1. Given that catch reports to ICCAT are incomplete, the Committee attempted to develop a more accurate estimate of shark mortality and capture related to the Atlantic tuna fleets on the basis of the expected proportions among swordfish and sharks and in the landings of these fleets (Figure 1) as well as using shark fin trade data. These information sets were used to reconstruct plausible estimates of historic catches used in blue shark assessments in 2015. A number of standardized CPUE data series for blue shark were presented in 2015 as relative indices of abundance. The Committee placed emphasis on using the series that pertained to fisheries that operate in oceanic waters over wide areas. Figure 2 presents the CPUE series available for the two stocks of this species. Considering the quantitative and qualitative limitations of the information available to the Committee, the results presented in 2015, as those of the 2008 and 2004 assessments (Anon. 2005c), are not conclusive. With regard to the species for which ERAs were conducted, the Committee understands that, in spite of existing uncertainties, results make it possible to identify those species that are more susceptible and vulnerable (based only on productivity) to prioritize research and management measures (Table 2). These ERAs are conditional on the biological variables used to estimate productivity as well as the susceptibility values for the different fleets and thus may change in the future as new information becomes available. 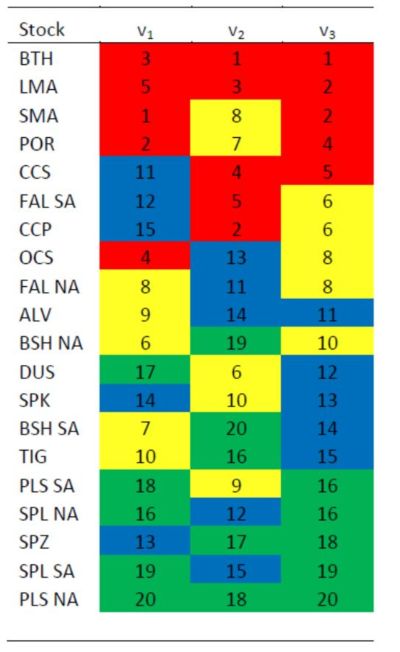 | Table 2 Vulnerability ranks for 20 stocks of pelagic sharks calculated with three methods: Euclidean distance (v1), multiplicative (v2), and arithmetic mean (v3). A lower rank indicates higher risk. Stocks listed in decreasing risk order according to the sum of the three indices. Red highlight indicates risks scores 1-5; yellow, 6-10; blue, 11-15; and green, 16-20. Productivity values ranked from lowest to highest.  |
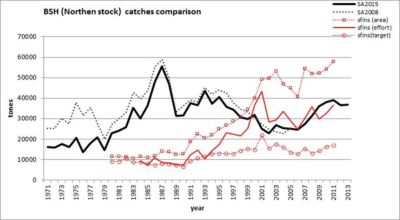 | | Figure 1 Comparison of various BSH-N catch series (1971 – 2013). In black, the stock assessment catches of 2008 (SA2008) and the current estimations (SA2015). In red, three catch series obtained using shark-fin ratios with three different approaches (area, effort, and, target level). |
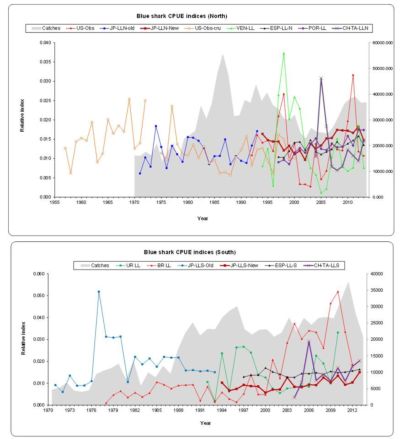 | | Figure 2 CPUE series used in the assessments of North and South Atlantic blue shark (BSH) stocks. Total catches used in the assessments are also shown. |
Bio Assess Results Ecological risk assessments for eleven priority species of sharks (including blue shark and shortfin mako) caught in ICCAT fisheries demonstrated that most Atlantic pelagic sharks have exceptionally limited biological productivity and, as such, can be overfished even at very low levels of fishing mortality. Specifically, the analyses indicated that bigeye threshers, longfin makos, and shortfin makos have the highest vulnerability (and lowest biological productivity) of the shark species examined (with bigeye thresher being substantially less productive than the other species). All species considered in the ERA, particularly smooth hammerhead, longfin mako, bigeye thresher and crocodile sharks, are in need of improved biological data to evaluate their biological productivity more accurately and thus specific research projects should be supported to that end. Table 2 provides a vulnerability ranking of the species considered. ERAs should be updated with improved information on the productivity and susceptibility of these species. For the North Atlantic stock, all scenarios considered with the Bayesian surplus production model and the integrated model (SS3) indicated that the stock was not overfished and that overfishing was not occurring, as was also concluded in the 2008 stock assessment (SHK Figure 3). However, the Committee acknowledged that there still remained a high level of uncertainty in data inputs and model structural assumptions, by virtue of which the possibility of the stock being overfished and overfishing occurring could not be ruled out. The Committee identified a better definition of fleets for SS3 and a more in depth historical catch reconstruction, especially discard estimates, as some of the main sources of uncertainty that may help to improve model fit and provide a more certain stock status in the future. 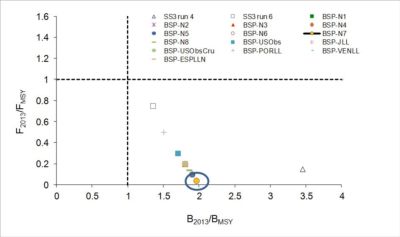 | | Figure 3 Phase plots summarizing scenario outputs for the current (for 2013) stock status of North Atlantic blue shark (BSH). BSP=Bayesian surplus production model; SS3=Stock synthesis model. The circle denotes common status for several BSP runs. Note that the x-axis values for SS3 are SSF2013/SSFMSY. |
Management Management unit: Yes Precautionary management measures should be considered particularly for stocks where there is the greatest biological vulnerability and conservation concern, and for which there are very few data and/or great uncertainty in assessment results Management measures should ideally be species-specific whenever possible. Considering the need to improve stock assessments of pelagic shark species impacted by ICCAT fisheries and bearing in mind Rec. 12-05 adopted in 2012 as well as the various previous recommendations which made the submission of shark data mandatory, the Committee strongly urges the CPCs to provide the corresponding statistics, including discards (dead or alive), of all ICCAT fisheries, including recreational and artisanal fisheries, and to the extent possible non-ICCAT fisheries capturing these species. The Committee considers that a basic premise for correctly evaluating the status of any stock is to have a solid basis to estimate total removals. The Committee reiterates that the CPCs provide estimates of shark catches in purse seines, gillnets, and artisanal fisheries. Estimates of shark entanglements in FADs are also important. Management measures should be applied to these sectors where catches of shark species are determined to be significant. Methods for mitigating shark by-catch by these fisheries also need to be investigated and applied. For the North Atlantic stock, while all model formulations explored predicted that the stock was not overfished and that overfishing was not occurring, the level of uncertainty in the data inputs and model structural assumptions was high enough to prevent the Committee from reaching a consensus on a specific management recommendation. | NORTH ATLANTIC BLUE SHARK SUMMARY | | Provisional Yield (2014) | | 36,516 t2 | | 2013 Yield | | 36,748 t1 | | | | | | Relative Biomass | B2013/BMSY | 1.35-3.453 | | | B2013/B0 | 0.75-0.984 | | Relative Fishing Mortality | FMSY | 0.19-0.204 | | | F2013/FMSY | 0.04-0.755 | | Overfished 2013 (Y/N) | | Not likely 6 | | Overfishing 2013 (Y/N) | | Not likely 6 | 1 Estimated catch used in the 2015 assessments (Anon. 2015c). 2 Task I catch. 3 Range obtained with the Bayesian Surplus Production (BSP) and SS3 models. Value from SS3 is SSF/SSF MSY. 4 Range obtained with the BSP model. 5 Range obtained with the BSP and SS3 models. 6 Although the models explored indicate the stock is not overfished and overfishing is not occurring, the Committee acknowledges that there still remains a high level of uncertainty. Sources “Report of the 2015 Meeting of the Standing Committee on Research and Statistics.” International Commission for the Conservation of Atlantic Tunas (ICCAT). 2015 ICCAT Report for biennial period, 2014-15 PART II (2015) - Vol. 2 ICCAT  http://iccat.int/Documents/BienRep/REP_EN_14-15_II-2.pdf http://iccat.int/Documents/BienRep/REP_EN_14-15_II-2.pdf“Report of the 2009 Meeting of the Standing Committee on Research and Statistics.” International Commission for the Conservation of Atlantic Tunas (ICCAT). 2010 ICCAT Report for biennial period, 2008-09 PART II (2009) - Vol. 2 ICCAT http://www.iccat.int/Documents/BienRep/REP_EN_08-09_II_2.pdf |
|
| |
|
|