Pelagic armourhead - South East Atlantic|
| Fact Sheet Title Fact Sheet |
| | | Pelagic armourhead - South East Atlantic |
| | Data Ownership | | This document provided, maintained and owned by South East Atlantic Fisheries Organisation (SEAFO) , is part of SEAFO Stock Status Reports data collection. |
| | ident Block | ident Block | | | | Species List: | | Species Ref: en - Pelagic armourhead, fr - Tête casquée pélagique, ru - Рыба-кабан |
|
|
| ident Block Pelagic armourhead - South East Atlantic Map tips - Click on
 to turn layers on and off to turn layers on and off - Double-click to zoom in
- Drag to pan
- Hold down the shift key and drag to zoom to a particular region
| fao Div |
|---|
| 47.B.0 | SEAFO division B.0 |
|---|
| 47.B.1 | SEAFO division B.1 |
|---|
| 47.C.0 | SEAFO division C.0 |
|---|
| 47.C.1 | SEAFO division C.1 |
|---|
|
|
|
|
| | Aq Res | Biological Stock: No Value: Regional
Management unit: Yes Reference year: 2020
|
| Considered a management unit: An aquatic resource or fishery is declared as [Fishery] Management Unit if it is effectively the focus for the application of selected management methods and measures, within the broader framework of a management system. According to the FAO Glossary for Responsible Fishing, "a Fishery Management Unit (FMU) is a fishery or a portion of a fishery identified in a Fishery Management Plan (FMP) relevant to the FMP's management objectives." FMU's may be organised around fisheries biological, geographic, economic, technical, social or ecological dimensions , and the makeup and attribute of a fishery management unit depends mainly on the FMP's management objectives. |
| Jurisdictional distribution: Jurisdictional qualifier (e.g. "shared", "shared - highly migratory") of the aquatic resource related with its spatial distribution. |
| Environmental group: Classification of the aquatic resource according to the environmental group (e.g. pelagic invertebrate, or demersal fish) to which the species belong. |
| Reference Year: The Reference Year is the last year considered in the stock assessment and/or fishery status. |
| | | | | | History The only fishery for Pelagic armourhead (southern boarfish) in recent years has been the Korean trawl fishery for southern boarfish that started in 2010. In the period 2010-2013 two fishing vessels participated, F/V Adventure and F/V Dongsan Ho, and there was no fishery as of September 2014. The fishery is described as a midwater trawl fishery, but the observer records submitted to SEAFO include a high proportion of hauls recorded as “Demersal” (94% of the observed tows). Whether or not these trawls were bottom trawls remains uncertain, and this is an issue that needs further attention and clarification. Habitat Bio Climatic Zone: Temperate. Bottom Type: Unspecified. Depth Zone: Slope - Upperslope (200 m - 500 m). Horizontal Dist: Oceanic. Vertical Dist: Demersal/Benthic. Geo Form: Seamounts. The Pentacerotid Pseudopentaceros richardsoni (Smith, 1844) is a southern circumglobal, benthopelagic species inhabiting outer shelf and upper continental shelves as well as seamounts and underwater ridges (100-1000 m) between 0 and 1000 m depth (Heemstra, 1986). The species inhabits such habitats at e.g. Tristan de Cunha, on the Walvis Ridge and seamounts off South Africa (Southeast Atlantic); south of Madagascar (Western Indian Ocean) as well as in southern Australia, New Zealand and the Southeast Pacific. The potential distribution area in the SEAFO CA and adjacent waters is shown in Figure 1. It is unlikely that the species is abundant south of about 40 °S, i.e. in Sub-Area D. It is known from adjacent areas that adults inhabit the steep and flat hard bottoms down to 800 m on the seamounts and underwater ridges in the open ocean. Eggs, larvae and juveniles are pelagic. Pelagic armourhead recruit to the summit of the seamounts after approximately 4 years of pelagic life and thereafter aggregates. 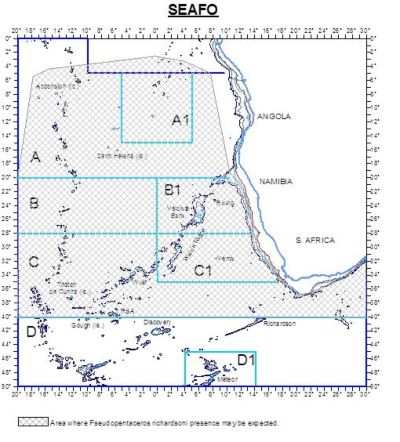 | Figure 1. Potential geographical distribution of P. richardsoni in the SEAFO CA and adjacent waters (source: Species profile on the SEAFO website referring to several sources).  |
Geo Dist Geo Dist: High Seas Purely During the period from 2010 to 2013 Korean trawler vessels (Dongsan Ho and/or Adventure) conducted a targeted fishery for Pelagic armourhead in the southern and northern parts of the Valdivia Bank, in Division B1 of the SEAFO CA. In 2013, a single haul was also conducted at North Walvis Ridge in Division B1 (Table 1, Fig. 2, lower). 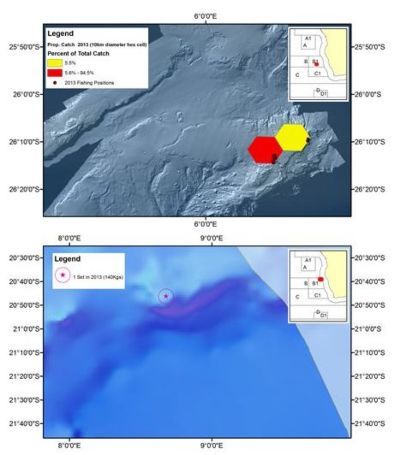 | | Figure 2. Spatial distribution of fishing positions and reported catches of Pelagic armourhead (P. richardsoni) aggregated to 10km diameter hexagonal cells, 2010-2013. Lower map shows the single fishing position in the NE seamount of B1 (NE Walvis Ridge) reported in 2013. Data from observer reports submitted to SEAFO until Sept. 2014. |
In 2017, only one vessel (trawler) from Namibia has conducted fishing activity in the SEAFO CA, targeting seamount species. Catches of pelagic armourhead took place in B1 and C0 (Fig. 3). 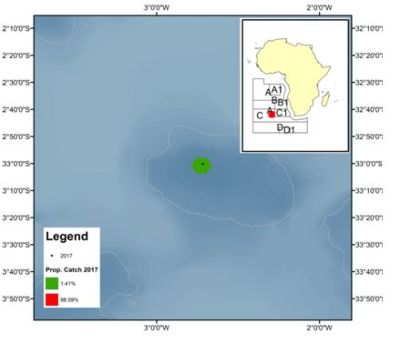 | | Figure 3. 2017 georeferenced fishing hauls and relative catches of Pelagic Armourhead (P. richardsoni) aggregated by 10km diameter hexagonal cells. Upper map shows the single fishing position in B1 and the lower map the fishing position in C. |
Table 1. Number of trawl hauls by year and location (ref. Fig. 2 & 3). | Year | Valdivia Bank | North Walvis Ridge | C0 | | 2010 | 63 | N/F | N/F | | 2011 | 88 | N/F | N/F | | 2012 | 117 | N/F | N/F | | 2013 | 9 | 1 | N/F | | 2014 | N/F | N/F | N/F | | 2015 | N/F | N/F | N/F | | 2016 | N/F | N/F | N/F | | 2017 | 1 | N/F | 1 | | 2018 | N/F | N/F | N/F | | 2019 | N/F | N/F | N/F | | 2020 | N/F | N/F | N/F | Water Area Overview  | | Water Area Overview Pelagic armourhead - South East Atlantic
| fao Div | 47.B.0: SEAFO division B.0 | | 47.B.1: SEAFO division B.1 | | 47.C.0: SEAFO division C.0 | | 47.C.1: SEAFO division C.1 |
| | | | | | Water Area Overview |
Water Area OverviewPelagic armourhead - South East Atlantic Aq Res Struct Biological Stock: No Exploit Starting in 1976, Table 2 presents the historical records of annual catches and bycatches of Pelagic armourhead by country, fishing gear and the SEAFO CA sub-divisions. The main fishing countries were: Russia that operated with bottom trawlers in the late 1970s and 1993; Ukraine (bottom trawl) fishing in the mid-1990s. Namibia and South Africa (bottom trawlers) in the mid-1990s; South Korea primarily operating with mid-water trawl in in the period 2010-2013. The higher annual catches were recorded by Russia with 1,273 and 1,000 t in 1977 and 1993, respectively, and by Korea with 688 t in 2010. Spain and Cyprus landed small catches in 2 and 1 years, respectively. Table 2. Reported catches (tonnes) of Pelagic armourhead (Pseudopentaceros richardsoni) from the SEAFO CA. Data reported by SEAFO CPs and other flag states reporting to SEAFO, and from FAO. | Nation | Namibia | Russia | Ukraine | South Africa | Spain | Cyprus | Rep. of Korea | | Management Area | B1 | C0 | B1 | UNK | B1 | B1 | UNK | B1 | | Fishing method | BT | BT | BT | BT | BT / LL | BT | MT | | Catch details | (t) | (t) | (t) | (t) | (t) | (t) | (t) | | | Catch | Catch | Catch | Catch | Catch | Discard | Catch | Discard | Catch | Catch | Discard | | 1976 | | N/F | 108 | | | | | | | | | | 1977 | | N/F | 1273 | | | | | | | | | | 1978 | | N/F | 53 | | | | | | | | | | 1993 | | N/F | 1000 | 435 FAO | | | | | | | | | 1994 | | N/F | | | | | | | | | | | 1995 | 8 | N/F | | 49 | 530 | | | | | | | | 1996 | 284 | N/F | | 281 | 201 | | | | | | | | 1997 | 559 | N/F | | 18 | 12 | | | | | | | | 1998 | N/F | N/F | | | | | | | | | | | 1999 | N/F | N/F | | | | | | | | | | | 2000 | 20 | N/F | | | | | | | | | | | 2001 | N/F | N/F | | | | | <1 | | | | | | 2002 | N/F | N/F | | | | | | | | | | | 2003 | 4 | N/F | | | | | 3 | | | | | | 2004 | | N/F | | | | | 3 | | 22 | | | | 2005 | | N/F | | | | | | | | | | | 2006 | | N/F | | | | | | | | | | | 2007 | | N/F | | | | | | | | | | | 2008 | | N/F | | | | | | | | | | | 2009 | N/F | N/F | N/F | N/F | N/F | | N/F | | N/F | N/F | | | 2010 | N/F | N/F | N/F | N/F | N/F | | N/F | | N/F | 688 | 0 | | 2011 | N/F | N/F | N/F | N/F | N/F | | N/F | | N/F | 135 | 0 | | 2012 | N/F | N/F | N/F | N/F | N/F | | N/F | | N/F | 152 | <1 | | 2013 | N/F | N/F | N/F | N/F | N/F | | N/F | | N/F | 13 | 0 | | 2014 | N/F | N/F | N/F | N/F | N/F | | N/F | | N/F | N/F | | | 2015 | N/F | N/F | N/F | N/F | N/F | | N/F | | N/F | N/F | | | 2016 | N/F | N/F | N/F | N/F | N/F | | N/F | | N/F | N/F | | | 2017 | <1 | N/F | N/F | N/F | N/F | | N/F | | N/F | <1 | 0 | | 2018 | N/F | N/F | N/F | N/F | N/F | | N/F | | N/F | N/F | | | 2019 | N/F | N/F | N/F | N/F | N/F | | N/F | | N/F | N/F | | | 2020 | N/F | N/F | N/F | N/F | N/F | | N/F | | N/F | N/F | | N/F = no fishing; UNK = Unknown; Blank fields = No data available; FAO = values from FAO; TB = Bottom Trawl; TM = Mid-water Trawl; LL = Longline; Bio Assess Populations of P. richardsoni, particularly the adult exploited fraction, have patchy distributions. The species occurs in a restricted depth stratum on the summit of seamounts and oceanic banks. Simple analyses of catch per unit of effort (CPUE) in the recent fisheries may be used as an indicator of biomass and may reveal temporal abundance trends. However, provided that sufficient input data are available, the pattern of distribution makes use of local depletion analysis, a potentially useful tool to evaluate the status of the population in specific areas. In the case of the SEAFO CA the actual fishing grounds in the recent fishery were primarily located in a small area of about 200 km 2 on Valdivia Bank. If sufficient length data are available, cohort analyses based on length may be possible. Processes and discussions in previous SC sessions are available in the Scientific Committee reports (SEAFO SC Report 2012 pages 21-23; SEAFO SC Report 2013 pages 17-18). In 2014 the exploration of different approaches continued. Depletion estimators were recalculated, and the Gulland approach adopted to estimate maximum sustainable yield (MSY) based on the estimate if initial biomass derived from the depletion model. Also, the SC considered length-based analyses as potentially complementary approaches to evaluate exploitation status, but due to the shortage of length data, that exploration was abandoned. Depletion estimators are widely used in fish and wildlife studies to estimate population abundance (Seber, 2002; Hilborn and Walters, 1992). These estimators assume a simple linear relationship between CPUE and cumulative effort (DeLury, 1947) or cumulative catch (Leslie and Davis, 1939). Data available suggest that prior to 2010 the stock was unexploited and consequently the Gulland (1971) method may be an approach to estimate MSY. Data Geo-referenced data on catch and effort were available from haul-by-hauls observer reports for the entire time-series of the recent Korean fishery (2010-2013). Logbooks were not available. No survey data from the period of the fishery was available from the area fished commercially or any other area of the SEAFO CA. In 2014 the SC reviewed length data collected by observers on Korean fishing vessels mainly operating in Valdivia Bank (Subdivision B1) in the period 2010-2013. No fishery has been conducted as of September 2014. Due to insufficient sampling, it was impossible to derive reliable length compositions of the catches (see below). Length frequency distributions and length data (e.g. ranges and mean lengths) presented in 2013 or earlier SC reports are considered invalid. Data on sampling levels are provided in Figure 4 and Table 3. The majority of trawl tows were sampled by observers, but in all years the sampling level in terms of total number of fish sampled, and number of individual sampled/tow (and per tonne) was inadequate. The sampling level even declined during the period 2010-2013. During the investigation of selected SEAFO seamounts in Jan-Feb 2015 by the RV Dr Fridtjof Nansen, pelagic armourhead were recorded in trawl catches and videos and attempts were made to record aggregations of these species by acoustics. Small aggregations were observed in videos on a summit knolls in Wüst, and a single aggregation in Valdivia Middle. Scattered individuals occurred on the upper slope of Vema. The main former fishing area on the Valdivia Bank appeared impoverished with only scattered individuals and no acoustic recordings. 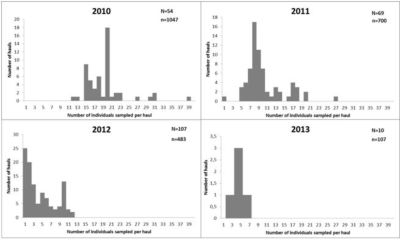 | | Figure 4. Frequency distributions of sample sizes for individual trawl hauls, 2010-2013 in the Valdivia Bank trawl fishery for Pelagic armourhead. The source is observer reports submitted to SEAFO until September 2014. N = total number of hauls sampled; n = total number of boarfish sampled. |
Table 3. Samples and sampling levels resulting from observer observations of the trawl on Valdivia Bank. Data on Pelagic armourhead only, as officially submitted to SEAFO until Sept. 2014. | Year | No. of trawl tows sampled | Mean #ind. sampled/tow | Min. #ind. sampled/tow | Max. #ind. sampled/tow | Mean #ind. sampled/tonne | | 2010 | 54 | 19.3 | 12 | 39 | 0.03 | | 2011 | 69 | 10.1 | 1 | 27 | 0.09 | | 2012 | 107 | 4.5 | 1 | 12 | 0.03 | | 2013 | 10 | 4.5 | 2 | 7 | 0.35 | Assess Models Length-weight relationships The weight-length relationship of Pelagic armourhead (for the two sexes combined) derived from samples collected by observers in 2010-2012 was: W = 0.016 L 3.048 (r 2 = 0.96) Available abundance indices and estimates of biomass Catch & effort data was available for the years 2010-2013 and used to calculate CPUE, as an indicator of stock biomass. Reproductive parameters The frequencies of Pelagic armourhead by maturity stage and sampling month for the period 2010-2012 are shown in Table 4. The fishing activity in SEAFO CA 2010-2012 was restricted to May and June, and the observer data suggest high proportions of pre-spawning and spawning stages (Fig. 4) and that spawning occurs after May but probably before September. This period is different from that observed in the Southwest Indian Ocean, i.e. between October and December (López-Abellán et al. 2007). However, in neither area were the entire year sampled. A maturity ogive based on the above data suggests 44.1 cm FL as the likely size at 50% maturity (Fig. 5). Table 4. Annual number of fish by maturity stage of Pelagic armourhead (Pseudopentaceros richardsoni) in the SEAFO CA for 2010-2012. Source: observer samples from Korean fishery. | Year | Maturity stage Month | Immature | Developing | Pre-spawning | Spawning | Spent | | 2010 | Sep | 0 | 504 | 159 | 0 | 0 | | | Oct | 0 | 437 | 107 | 0 | 0 | | | Nov | 0 | 84 | 26 | 0 | 0 | | | | | | | | | | 2011 | Jan | 14 | 78 | 27 | 0 | 0 | | | Sep | 59 | 75 | 4 | 0 | 0 | | | Oct | 30 | 26 | 13 | 0 | 0 | | | Nov | 0 | 16 | 27 | 2 | 0 | | | | | | | | | | 2012 | May | 0 | 0 | 38 | 96 | 0 | | | Jun | 0 | 0 | 69 | 352 | 0 | 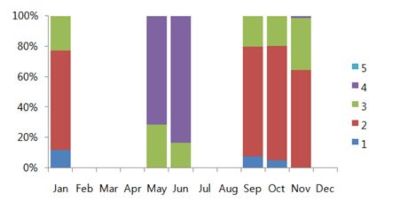 | | Figure 5. The proportion of maturity stage by month of Pelagic Armourhead (Pseudopentaceros richardsoni) in the SEAFO CA for 2010-2012 (1: immature, 2: developing, 3: pre-spawning, 4: spawning and 5: spent). |
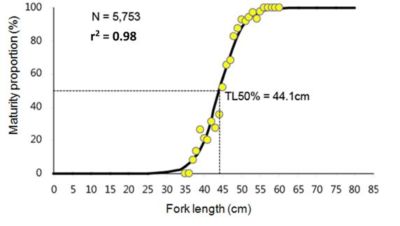 | | Figure 6. The maturity proportion by length of Pelagic armourhead (Pseudopentaceros richardsoni) on the Valdivia Bank in the SEAFO CA (Division B1). |
Natural mortality Empirical natural mortality estimates for Pelagic armourhead were calculated by different methods and using the estimates of growth parameters derived from growth studies on the same species from the Southwest Indian Ocean (López-Abellán et al. 2008a) and on Valdivia Bank during the Spanish-Namibian research surveys reported on earlier (López-Abellán et al. 2008b). The growth parameters fitted were: K=0.27 year-1; L inf=65.1 cm; and t 0=-0.34 year-1. The maximum observed age of the Pelagic armourhead in the Southwest Indian Ocean was 14 years. The values of empirical natural mortality obtained using different methods were determined using the Fishmethods R package: | Method | M | | Pauly (1980) - Length Equation | 0.457 | | Hoenig (1983) - Joint Equation | 0.316 | | Hoenig (1983) - Fish Equation | 0.300 | | Alverson and Carney (1975) | 0.253 | | Roff (1984) | 0.417 | | Gunderson and Dygert (1988) | 0.089 | The natural mortality M=0.3 for the Pelagic armourhead calculated using the Hoenig’s method was considered acceptable and used in the analyses below. The effect of using M=0.2 was illustrated. The average longevity for stocks in the data set used by Hoenig (1983) is the age at which about 1.5% of the stock remains alive (Hewitt and Hoenig, 2005). Results Ref Point Apart from the provisional estimate of MSY=128 t, no reference points have been estimated and found to be valid. The main reason is the shortage of basic data to carry out assessments. In 2014 SC recommended that a harvest control rule be implemented and suggested as a candidate HCR the following: Where ‘Slope’ = average slope of the Biomass Indicator (CPUE) in the recent 5 years and: λu :TAC control coefficient if slope > 0 (Stock seems to be growing): λu=1 λd :TAC control coefficient if slope < 0 (Stock seems to be decreasing): λd=2 Results The catches of P. richardsoni were derived from a directed fishery on Valdivia Bank held in a very small area, where the adults concentrated. Such species spatial distribution pattern makes it highly vulnerable to overfishing. The biomass index derived from onboard observer data Korean fishery targeting Pelagic armourhead show a strong decrease (in 2011 the CPUE was approximately 16% of that in 2010). After 2011 the values of CPUE remained stable but very low levels. The depletion model run adjusted for the year 2010 showed a significant negative regression slope and the regression explained near 40% of the variance. Similar perception of the stock development could be depicted from the analysis of CPUE time series and from depletion model. No valid size or age distributions allowing evaluation of trends in size-age structure of the stock through time, as well as, no recruitment indexes were available. However, under the assumption of a 4-year recruitment age, it was expected that until 2015 the entries in the population mainly come from year classes born prior to 2010, i.e. before the fishery started. The current perception of the stock fished primarily on the Valdivia Bank is that it is reduced to a low level.The 2010-2013 fishery for armourhead was mainly conducted on the Valdivia Bank. A single catch was, however, also reported from a seamount in the northeastern corner of B1. The true distribution of the species in the SEAFO CA is probably wider, but the areas of suitable character and depth, i.e. shallower than 600m and north of 40 oN, are few and widely dispersed (Figure 7). Fisheries expanding into other areas also have to be closely monitored and regulated. There is no information on recruitment, and it is not known whether the concentrations of the species constitute a self-sustaining population or are sustained by immigration/influx of larvae and juveniles from other areas. Furthermore, it is unknown if the 2013 biomass estimate on Valdivia Bank was above or below a level at which recruitment is impaired. In recent years, i.e. 2014 onwards, there is no further information that allows to perceive the status of the adult population in Valvidia Bank. 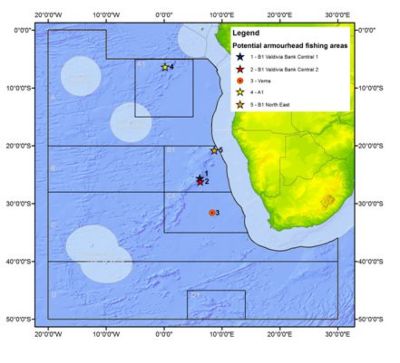 | | Figure 7. Bathymetry of the SEAFO CA and locations with bottom depths of 600m or less. |
Management Management unit: Yes Advice Considering that the TACs set for Pelagic armourhead under CM-TAC-01 (2020) is reviewed every two years, and that the last review was done in 2018 for the period from 2019 – 2020. No assessment was conducted in 2020 due to the impact of the Covid 19 worldwide pandemic. The TAC as set for 2019-2020 was rolled over to 2021. The TAC advised in 2014 was derived using the average of the catches in 2011 and 2012. This is a simplistic approach not based on stock assessments or stock trend indices, hence the resulting TAC advice will be uncertain. Currently, due to the interruption of the fishery, the recommended and accepted HCR cannot be applied, nor the average of recent catches as in 2014. Due to the lack of recent fishery data there is even greater uncertainty than in 2014. Prior to the interruption of the fishery, the catch per unit of effort had declined to a low level. The survey in 2015 did not detect concentrations of armourhead in the previous fishing area at that time. It was expressed that the absence of a fishery has provided a potential for recovery. Due to the uncertainties explained above, SC members expressed different views on the TAC advice for 2017-2018 for the SEAFO CA. The agreed advice is a TAC of 135 tonnes. This level is slightly lower than that derived in 2014, hence possibly more precautionary. It must be emphasized that the state of the stock is unknown. Sources South East Atlantic Fisheries Organisation (SEAFO). Personal Communication. August 2021. Bibliography DeLury, D.B. “On the estimation of biological populations. Biometrics, 3: 145–167.” 1947. Garcia, S.M., P. Sparre, J. Csirke “Estimating surplus production and maximum sustainable yield from biomass data when catch and effort time series are not available. Fish. Res. 8, 13-23.” 1989. Gulland, J.A. “The Fish Resources of the Ocean. Fishing News (Books), West Byfleet, 255 pp.” 1971. Heemstra, P.C. “Pentacerotidae. p. 622-623. In M.M. Smith and P.C. Heemstra (eds.) Smiths' sea fishes. Springer-Verlag, Berlin.” 1986. Hewitt, D. A. and J.M. Hoenig “Comparison of two approaches for estimating natural mortality based on longevity. Fishery Bulletin, 103(2): 433-437.” 2005. Hilborn, R. and C.J. Walters “Quantitative Fisheries Stock assessment: Choice, Dynamics and Uncertainty. Chapman and Hall: 570 pp.” 1992. Hoenig, J.M. “Empirical Use of Longevity Data to Estimate Mortality Rates. Fishery Bulletin 82:898-903.” 1983. Leslie, P.H. and D.H.S. Davis “An attempt to determine the absolute number of rats on a given area. J. Anim. Ecol., 8: 94–113.” 1939. Gili, R., L. Cid, H. Pool, Z. Young, D. Tracey, P. Horne and P. Marriott “Estudio de edad, crecimiento y mortalidad natural de los recursos orange roughy y alfonsino. FIP 2002-12. Informe Final. IFOP-SUBPESCA. 129 p. Age, growth and natural mortality of orange roughy and alfonsino. (Final report FIP N° 2000-12. 129 p. (In Spanish).” 2002. López-Abellán, L.J., M.T.G. Santamaría and J.F. González “Approach to ageing and growth back-calculation based on the otolith of the southern boardfish Pseudopentaceros richardsoni (Smith, 1844) from the south-west Indian Ocean seamounts. Marine and freshwater Research 59: 269-278.” 2008.a. López-Abellán, L.J., J.A. Holtzhausen, L.M. Agudo, P. Jiménez, J.L. Sanz, M. González-Porto, S. Jiménez, P. Pascual, J.F. González, C. Presas, E. Fraile and M. Ferrer “Preliminary report of the multidisciplinary research cruise on the Walvis Ridge seamounts (Atlantic Southeast-SEAFO). Part I-II: 191 pp.” 2008.b  http://www.repositorio.ieo.es/e-ieo/handle/10508/370?locale-attribute=en http://www.repositorio.ieo.es/e-ieo/handle/10508/370?locale-attribute=en Seber, G.A.F. “The Estimation of Animal Abundance and Related Parameters. Second Edition. Blackburn Press, New Jersey.” 2002. |
|
| |
|
|


