Patagonian toothfish - South East Atlantic|
| Fact Sheet Title Fact Sheet |
| | | Patagonian toothfish - South East Atlantic |
| | Data Ownership | | This document provided, maintained and owned by South East Atlantic Fisheries Organisation (SEAFO) , is part of SEAFO Stock Status Reports data collection. |
| | ident Block | ident Block | | | | Species List: | | Species Ref: en - Patagonian toothfish, fr - Légine australe, es - Austromerluza negra, ru - Клыкач патагонский |
|
|
| ident Block Patagonian toothfish - South East Atlantic Map tips - Click on
 to turn layers on and off to turn layers on and off - Double-click to zoom in
- Drag to pan
- Hold down the shift key and drag to zoom to a particular region
| fao Div |
|---|
| 47.C.0 | SEAFO division C.0 |
|---|
| 47.C.1 | SEAFO division C.1 |
|---|
| 47.D.0 | SEAFO division D.0 |
|---|
| 47.D.1 | SEAFO division D.1 |
|---|
|
|
|
|
| | Aq Res | Biological Stock: No Value: Regional
Management unit: Yes Reference year: 2020
|
| Considered a management unit: An aquatic resource or fishery is declared as [Fishery] Management Unit if it is effectively the focus for the application of selected management methods and measures, within the broader framework of a management system. According to the FAO Glossary for Responsible Fishing, "a Fishery Management Unit (FMU) is a fishery or a portion of a fishery identified in a Fishery Management Plan (FMP) relevant to the FMP's management objectives." FMU's may be organised around fisheries biological, geographic, economic, technical, social or ecological dimensions , and the makeup and attribute of a fishery management unit depends mainly on the FMP's management objectives. |
| Jurisdictional distribution: Jurisdictional qualifier (e.g. "shared", "shared - highly migratory") of the aquatic resource related with its spatial distribution. |
| Environmental group: Classification of the aquatic resource according to the environmental group (e.g. pelagic invertebrate, or demersal fish) to which the species belong. |
| Reference Year: The Reference Year is the last year considered in the stock assessment and/or fishery status. |
| | | | | | History Fishing for Patagonian toothfish in the SEAFO CA started around 2002. The main fishing countries working in the area include vessels from Japan, South Korea, Spain and South Africa. Historically a maximum of four vessels per year fished in the SEAFO CA. The Spanish longline system and the Trotline (Fig. 1) are the fishing gears commonly used. 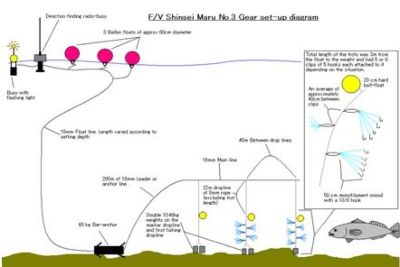 | Figure 1. Fishing gears used to fish D. eleginoides: Spanish longline system (top) and the Trotline (bottom).  |
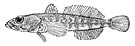
Habitat Bio Climatic Zone: Temperate; Polar. Bottom Type: Unspecified. Depth Zone: Abyssal ( >1000m). Horizontal Dist: Oceanic. Vertical Dist: Demersal/Benthic. Patagonian toothfish is a southern circumpolar, eurybathic species (70-1600m), associated with shelves of the sub-Antarctic islands usually north of 55ºS. Young stages are pelagic (North, 2002). The species occurs in the Kerguelen-Heard Ridge, islands of the Scotia Arc and the northern part of the Antarctic Peninsula (Hureau, 1985; DeWitt et al., 1990). This species is also known from the southern coast of Chile northward to Peru and the coast of Argentina, especially in the Patagonian area (DeWitt, 1990), and also present in Discovery and Meteor seamounts in the SE Atlantic (Figure 3) and El Cano Ridge in the South Indian Ocean (López-Abellán and Gonzalez, 1999; López-Abellán, 2005). In SEAFO CA the stock structure of the species is unknown. The CCAMLR Scientific Committee in 2009 noted that in most years (since 2003) the main species caught in CCAMLR sub-area 48.6 (adjacent to and directly south of SEAFO Division D) is D. eleginoides. The distribution of the species appears to be driven by the sub-Antarctic front which extends into the SEAFO CA. 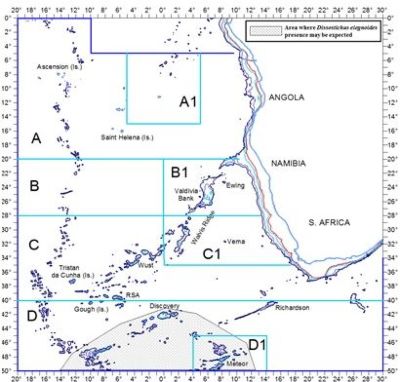 | | Figure 2. Species geographical distribution in the SEAFO CA (source: Species profile on the SEAFO website). |
Geo Dist Geo Dist: Straddling between High Seas and EEZ In SEAFO CA, the fishery from 2011 to 2017 took place in Sub-Area D, being concentrated over seamounts in Division D1, at Discovery seamount and also at seamounts located in the western part of Sub-Area D (Fig. 3). 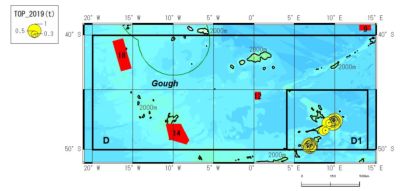 | | Figure 3. Reported catch of Patagonian toothfish (Dissostichus eleginoides) aggregated to 100 km diameter hexagonal cells (2011-2019). |
Table 1. Number of sets by year and location. (*) Preliminary to September | Year | Western | Discovery | D1- Meteor | | 2010 | 27 | 5 | 118 | | 2011 | 1 | 207 | 54 | | 2012 | 68 | 207 | 25 | | 2013 | 0 | 108 | 57 | | 2014 | 100 | 64 | 13 | | 2015 | 0 | 24 | 127 | | 2016 | 0 | 22 | 67 | | 2017 | 34 | 0 | 0 | | 2018 | 0 | 0 | 100 | | 2019 | 0 | 0 | 75 | | 2020(*) | 0 | 56 | 24 | Water Area Overview  | | Water Area Overview Patagonian toothfish - South East Atlantic
| fao Div | 47.C.0: SEAFO division C.0 | | 47.C.1: SEAFO division C.1 | | 47.D.0: SEAFO division D.0 | | 47.D.1: SEAFO division D.1 |
| | | | | | Water Area Overview |
Water Area OverviewPatagonian toothfish - South East Atlantic Aq Res Struct Biological Stock: No Exploit Table 2 presents data on Patagonian toothfish catches and discards listed by country, as well as fishing gear used and the management area from which catches were taken. Discards were mainly due to parasite infection of fish. In the last three years with complete data (2018, 2019 and 2020) retained catches were 57, 63 and 63 t respectively and the annual weight of discarded specimens was less than 1 t in the three-year period. Table 2. Catches (tons) of Patagonian toothfish (Dissostichus eleginoides) by South Africa, Spain, Japan and Korea. | Nation | Spain | Japan | Korea | South Africa | | Fishing method | Longlines | Longlines | Longlines | Longlines | | Management Area | D | D1 | D0 | D1 | D0 | D1 | D0 | D1 | | Year | Ret. | Dis. | Ret. | Dis. | Ret. | Dis. | Ret. | Dis. | Ret | Dis. | Ret. | Dis. | Ret. | Dis. | Ret. | Dis. | | 2002 | 18 | 0 | | | N/F | N/F | N/F | N/F | N/F | N/F | N/F | N/F | N/F | N/F | N/F | N/F | | 2003 | 101 | 0 | | | 47 | 0 | N/F | N/F | 245 | 0 | N/F | N/F | N/F | N/F | N/F | N/F | | 2004 | 6 | 0 | | | 124 | 0 | N/F | N/F | N/F | N/F | N/F | N/F | N/F | N/F | N/F | N/F | | 2005 | N/F | N/F | | | 158 | 0 | N/F | N/F | 10 | 0 | N/F | N/F | N/F | N/F | N/F | N/F | | 2006 | 11 | 0 | | | 155 | 0 | N/F | N/F | N/F | N/F | N/F | N/F | N/F | N/F | N/F | N/F | | 2007 | N/F | N/F | | | 166 | 0 | N/F | N/F | N/F | N/F | N/F | N/F | N/F | N/F | N/F | N/F | | 2008 | N/F | N/F | | | 122 | 0 | N/F | N/F | 76 | 0 | N/F | N/F | N/F | N/F | N/F | N/F | | 2009 | N/F | N/F | | | N/F | N/F | 74 | 0 | 16 | 0 | 46 | 0 | N/F | N/F | N/F | N/F | | 2010 | 26 | 0 | | | N/F | N/F | 54 | 2 | N/F | N/F | N/F | N/F | N/F | N/F | N/F | N/F | | 2011 | N/F | N/F | | | 159 | 6 | N/F | N/F | N/F | N/F | N/F | N/F | 15 | 0 | 28 | 0 | | 2012 | N/F | N/F | | | 86 | 3 | N/F | N/F | N/F | N/F | N/F | N/F | 24 | 0 | 12 | 0 | | 2013 | N/F | N/F | | | 41 | 2 | 19 | 1 | N/F | N/F | N/F | N/F | N/F | N/F | N/F | N/F | | 2014 | N/F | N/F | | | 47 | <1 | 6 | <1 | N/F | N/F | N/F | N/F | N/F | N/F | N/F | N/F | | 2015 | N/F | N/F | | | 52 | <1 | 7 | <1 | N/F | N/F | N/F | N/F | N/F | N/F | N/F | N/F | | 2016 | N/F | N/F | | | 7 | <1 | 53 | <1 | N/F | N/F | N/F | N/F | N/F | N/F | N/F | N/F | | 2017 | N/F | N/F | | | 12 | <1 | N/F | N/F | N/F | N/F | N/F | N/F | N/F | N/F | N/F | N/F | | 2018 | N/F | N/F | | | N/F | N/F | 57 | <1 | N/F | N/F | N/F | N/F | N/F | N/F | N/F | N/F | | 2019 | N/F | N/F | | | 26 | 1 | 37 | <1 | N/F | N/F | N/F | N/F | N/F | N/F | N/F | N/F | | 2020 | N/F | N/F | 58 | 0 | 5 | <1 | N/F | N/F | N/F | N/F | N/F | N/F | N/F | N/F | N/F | N/F | N/F = No Fishing; Blank fields = No data available; Ret.= Retained catch; Dis. = Discarded catch Table 3. Catches (tons) of Antarctic toothfish (Dissostichus mawsoni) by South Africa, Spain, Japan and Korea. (*) Preliminary to September. | Nation | Japan | SPAIN | | Fishing method | Longlines | Longlines | | Management Area | D0 | D1 | D0 | D1 | | Catch details (t) | Ret. | Disc. | Ret. | Disc. | Ret. | Disc. | Ret. | Disc. | | 2014 | ˂ 1 | 0 | 0 | 0 | N/F | N/F | N/F | N/F | | 2015 | 0 | 0 | 0 | 0 | N/F | N/F | N/F | N/F | | 2016 | 0 | 0 | 0 | 0 | N/F | N/F | N/F | N/F | | 2017 | 0 | 0 | N/F | N/F | N/F | N/F | N/F | N/F | | 2018 | N/F | N/F | 0 | 0 | N/F | N/F | N/F | N/F | | 2019 | N/F | N/F | 0 | 0 | N/F | N/F | N/F | N/F | | 2020(*) | 0 | 0 | N/F | N/F | N/F | N/F | 0 | 0 | N/F = No Fishing; Blank fields = No data available; Ret. = Retained; Disc. = Discarded Bio Assess There are no agreed stock assessments. Data The number of fishing sets sampled from 2009 onwards (including all bottom longliners) indicates a good sampling level in line with the SEAFO preliminary guidelines for data collection (Table 5). On average, samplings were conducted in 98% of the total sets and 19 specimens were measured per sampled fishing set, which is considered acceptable given the length range of the exploited population. In future it will be necessary to apply this sampling effort of 20 individuals in all sampled fishing sets. 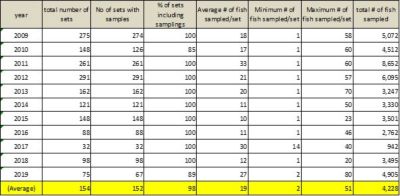 | | Table 5. The Annual total number of sets and sampling effort (2009-2019*) (Include the number of fish sampled. |
Assess Models Length-weight relationships Table 6 shows the length-weight relationships by sex based on observer data from Japanese fleet in 2013. Table 6. Length-weight relationships by sex based on observer data from Japanese fleet in 2013. | Samples | a | b | r2 | n | | Males | 1E-06 | 3.4484 | 0.9768 | 405 | | Females | 2E-06 | 3.4296 | 0.9579 | 860 | Age and growth parameters There is no available information for this species in the SEAFO CA. Reproductive parameters There is no available information for this species in the SEAFO CA. Natural Mortality There is no available information for this species in the SEAFO CA. Feeding and trophic relationships (including species interaction) There is no available information for this species in the SEAFO CA. Tagging and migration Eleven specimens were tagged in Subarea D in 2006 and fourteen in 2010 (Spanish flagged Viking Bay vessel). However, there is no available information on recoveries of tagged specimens or on tagged specimens tagged at adjacent areas of CCAMLR. Results Ref Point In 2015, the Commission adopted Harvest Control Rule (HCR) to decide TAC if no agreed stock assessments are available. This HCR had been applied in NAFO (Greenland halibut during 2011-2017) and CCSBT (southern bluefin tuna), which uses average of slopes of CPUE in recent 5 years (Fig. 5). In the HCR, standardized CPUE is preferable to apply. Although SC estimated standardized CPUE using generalised linear models (GLM) five times in the past (2014, 2015, 2016-twice and 2018), all results indicated that correlation coefficients (goodness of fitness) were too low (r2 < 30%) to provide the plausible standardized CPUE for the HCR and SC did not agreed to use standardized CPUE for HCR Then SC12 (2016) agreed to apply nominal CPUE for the HCR. As nominal Japanese CPUE in the Meteor and Discovery seamounts areas are continuously available (2003-2018), SC12 (2016) agreed to use the slope of average of two nominal CPUE and applied in 2016. 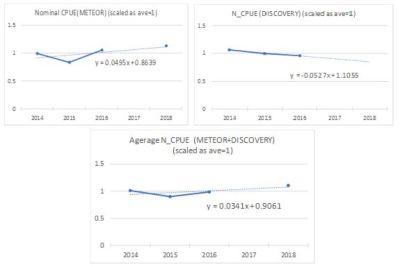 | | Figure 5. Upper: Nominal CPUE trend and its slope in Meteor (left) and Discovery(right) areas in recent 5 years (2014-2018). Lower: Average CPUE trend of two nominal CPUE and its slope. |
Computation of TAC (2019-2020) using HCR: Slope (2014-2018) (Discovery) = -0.527 Slope (2014-2018) (Meteor) = +0.495 Slope (2014-2018) (based on average N_CPUE in 2 areas) = +0.0341 TAC (2019-20) = TAC (2017-2018) * (1+0.0341) =266(ton)*1.0341=275(ton) Difference (%) = (275-266)/266=0.034(3.4%) < 5% Hence TAC (2019-2020) = 275 tons Management Management unit: Yes Advice Using the same method, TAC for 2019-2020 is computed as 275 t for Sub-Area D (Box 1) in SC (2018). Then SC (2018) recommends TAC for Sub-Area D of 275 t and a zero TAC for the remainder of the SEAFO CA for the years 2019 and 2020. Considering that the TACs set under CM-TAC-01 (2020) is reviewed every two years, and that the last review was done in 2018 for the period from 2019 – 2020. No assessment was conducted in 2020 due to the impact of the Covid 19 worldwide pandemic. The TAC as set for 2019-2020 was rolled over to 2021. Sources South East Atlantic Fisheries Organisation (SEAFO). Personal Communication. August 2021. Bibliography Arana, P. “Reproductive aspects of the Patagonian toothfish (Dissostichus eleginoides) off southern Chile. Lat. Am. J. Aquat. Res., 37(3): 381-394.” 2009. Dewitt, H.H., P.C. Heemstra and O. Gon. “Nototheniidae. In: Fishes of the Southern Ocean, O. Gon and P.C. Heemstra (Eds.). J.L.B. Smith Institute of Ichthyology, Grahamstown, South Africa: 279-331.” 1990. Horn, P.L. “Age and growth of Patagonian toothfish (Dissostichus eleginoides) and Antarctic toothfish (D. mawsoni) in waters from the New Zealand subantarctic to the Ross Sea, Antarctica Fisheries Research, 56:275-287.” 2002. Hureau, J.C. “Family Nothoteniidae-Antarctic rock cods. In: FAO species identification sheets for fishery purposes. Southern Ocean: Fishing Areas 48, 58 and 88 (CCAMLR Convention Area). Fischer, W. and J.C. Hureau (Eds). FAO, Rome, vols. I-II, 470 p.” 1985. López-Abellán L.J. and J. González “Results of the longline survey on the seamounts in the southeast Atlantic and in the CCAMLR Subarea 48.6 (Atlantic Ocean) and Division 58.4.4 (Indian Ocean). CCAMLR Science, Vol. 6: 99-116.” 1999  http://www.ccamlr.org/en/system/files/science_journal_papers/08lopez-abellan.pdf http://www.ccamlr.org/en/system/files/science_journal_papers/08lopez-abellan.pdf López-Abellán, L.J. “Patagonian toothfish in international waters of the Southwest Indian Ocean (Statistical Area 51). CCAMLR Science, 12: 207–214.” 2005 http://www.ccamlr.org/en/system/files/science_journal_papers/13lopez-abellan.pdf Prager, M. “User’s Manual for ASPIC: A Stock-Production Model Incorporating Covariates (ver. 5) and auxiliary programs, Population Dynamics Team, Center for Coastal Fisheries and Habitat Research, National Oceanic and Atmospheric Administration, 101 Pivers Island Road, Beaufort, North Carolina 28516 USA: National Marine Fisheries Service Beaufort Laboratory Document BL-2004-01.” 2004. |
|
| |
|
|