|
| Fact Sheet Title Fact Sheet |
| |
| Hake - Greater North Sea, Celtic Seas and Bay of Biscay North and Central |
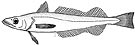
 | Hake (Merluccius merluccius) in Subareas 4, 6, and 7, and Divisions 3.a, 8.a-b, and 8.d, Northern stock (Greater North Sea, Celtic Seas, and the northern Bay of Biscay) |
| | Data Ownership | | This document provided, maintained and owned by International Council for the Exploration of the Sea (ICES) , is part of ICES Advice data collection. |
|
| ident Block | ident Block | | | | Species List: | | Species Ref: en - European hake, fr - Merlu européen, es - Merluza europea, ru - Мерлуза восточноатлантическая |
Fishery IndicatorsProduction: Landed Volume; Catch |
|
| ident Block Hake - Greater North Sea, Celtic Seas and Bay of Biscay North and Central Map tips - Click on
 to turn layers on and off to turn layers on and off - Double-click to zoom in
- Drag to pan
- Hold down the shift key and drag to zoom to a particular region
| fao Div |
|---|
| 27.3.a | Skagerrak and Kattegat (Division 27.3.a) |
|---|
| 27.8.a | Bay of Biscay - North (Division 27.8.a) |
|---|
| 27.8.b | Bay of Biscay - Central (Division 27.8.b) |
|---|
| 27.8.d | Bay of Biscay - Offshore (Division 27.8.d) |
|---|
| fao Sub Area |
|---|
| 27.4 | North Sea (Subarea 27.4) |
|---|
| 27.6 | Rockall, Northwest Coast of Scotland and North Ireland (Subarea 27.6) |
|---|
| 27.7 | Irish Sea, West of Ireland, Porcupine Bank, Eastern and Western English Channel, etc (Subarea 27.7) |
|---|
|
|
|
|
|
| Aq Res | Biological Stock: Yes Value: Sub-Regional
Management unit: Yes Reference year: 2019
|
| Considered a management unit: An aquatic resource or fishery is declared as [Fishery] Management Unit if it is effectively the focus for the application of selected management methods and measures, within the broader framework of a management system. According to the FAO Glossary for Responsible Fishing, "a Fishery Management Unit (FMU) is a fishery or a portion of a fishery identified in a Fishery Management Plan (FMP) relevant to the FMP's management objectives." FMU's may be organised around fisheries biological, geographic, economic, technical, social or ecological dimensions , and the makeup and attribute of a fishery management unit depends mainly on the FMP's management objectives. |
| Jurisdictional distribution: Jurisdictional qualifier (e.g. "shared", "shared - highly migratory") of the aquatic resource related with its spatial distribution. |
| Environmental group: Classification of the aquatic resource according to the environmental group (e.g. pelagic invertebrate, or demersal fish) to which the species belong. |
| Reference Year: The Reference Year is the last year considered in the stock assessment and/or fishery status. |
| | | | | | Habitat Bio Depth Zone: Shelf (50 m - 200 m). Vertical Dist: Demersal/Benthic. Water Area Overview Spatial Scale: Sub-Regional Water Area Overview  | | Water Area Overview Hake - Greater North Sea, Celtic Seas and Bay of Biscay North and Central
| fao Div | 27.3.a: Skagerrak and Kattegat (Division 27.3.a) | | 27.8.a: Bay of Biscay - North (Division 27.8.a) | | 27.8.b: Bay of Biscay - Central (Division 27.8.b) | | 27.8.d: Bay of Biscay - Offshore (Division 27.8.d) | | fao Sub Area | 27.4: North Sea (Subarea 27.4) | | 27.6: Rockall, Northwest Coast of Scotland and North Ireland (Subarea 27.6) | | 27.7: Irish Sea, West of Ireland, Porcupine Bank, Eastern and Western English Channel, etc (Subarea 27.7) |
| | | | | | Water Area Overview |
Water Area OverviewHake - Greater North Sea, Celtic Seas and Bay of Biscay North and Central | fao Major | 27: Atlantic, Northeast | | Large Marine Ecosystem Areas (LME) | 22: North Sea | | 24: Celtic-Biscay Shelf | | 25: Iberian Coastal | | 60: Faroe Plateau |
Aq Res Struct Biological Stock: Yes Exploit Fishery Indicators | Type | Measure | Value | Unit | Time period |
|---|
| Production | Landed Volume | 50551 | tonnes | 1978 | | Landed Volume | 51096 | tonnes | 1979 | | Landed Volume | 57265 | tonnes | 1980 | | Landed Volume | 53918 | tonnes | 1981 | | Landed Volume | 54994 | tonnes | 1982 | | Landed Volume | 57507 | tonnes | 1983 | | Landed Volume | 63286 | tonnes | 1984 | | Landed Volume | 56099 | tonnes | 1985 | | Landed Volume | 57092 | tonnes | 1986 | | Landed Volume | 63369 | tonnes | 1987 | | Landed Volume | 64823 | tonnes | 1988 | | Landed Volume | 66473 | tonnes | 1989 | | Landed Volume | 59954 | tonnes | 1990 | | Landed Volume | 58129 | tonnes | 1991 | | Landed Volume | 56617 | tonnes | 1992 | | Landed Volume | 52144 | tonnes | 1993 | | Landed Volume | 51259 | tonnes | 1994 | | Landed Volume | 57621 | tonnes | 1995 | | Landed Volume | 47210 | tonnes | 1996 | | Landed Volume | 42465 | tonnes | 1997 | | Landed Volume | 35060 | tonnes | 1998 | | Landed Volume | 39814 | tonnes | 1999 | | Landed Volume | 42026 | tonnes | 2000 | | Landed Volume | 36675 | tonnes | 2001 | | Landed Volume | 40107 | tonnes | 2002 | | Landed Volume | 43162 | tonnes | 2003 | | Landed Volume | 46417 | tonnes | 2004 | | Landed Volume | 46550 | tonnes | 2005 | | Landed Volume | 41467 | tonnes | 2006 | | Landed Volume | 45028 | tonnes | 2007 | | Landed Volume | 47739 | tonnes | 2008 | | Landed Volume | 58818 | tonnes | 2009 | | Landed Volume | 72799 | tonnes | 2010 | | Landed Volume | 87540 | tonnes | 2011 | | Landed Volume | 85677 | tonnes | 2012 | | Landed Volume | 77753 | tonnes | 2013 | | Landed Volume | 89940 | tonnes | 2014 | | Landed Volume | 93670 | tonnes | 2015 | | Landed Volume | 109106 | tonnes | 2016 | | Landed Volume | 104671 | tonnes | 2017 | | Landed Volume | 89671 | tonnes | 2018 | | Landed Volume | 82298 | tonnes | 2019 |
Fishery Indicators | Type | Measure | Value | Unit | Time period |
|---|
| Production | Catch | 50551 | tonnes | 1978 | | Catch | 51096 | tonnes | 1979 | | Catch | 57265 | tonnes | 1980 | | Catch | 53918 | tonnes | 1981 | | Catch | 54994 | tonnes | 1982 | | Catch | 57507 | tonnes | 1983 | | Catch | 63286 | tonnes | 1984 | | Catch | 56099 | tonnes | 1985 | | Catch | 57092 | tonnes | 1986 | | Catch | 63369 | tonnes | 1987 | | Catch | 64825 | tonnes | 1988 | | Catch | 66546 | tonnes | 1989 | | Catch | 59954 | tonnes | 1990 | | Catch | 58129 | tonnes | 1991 | | Catch | 56617 | tonnes | 1992 | | Catch | 52144 | tonnes | 1993 | | Catch | 51615 | tonnes | 1994 | | Catch | 57621 | tonnes | 1995 | | Catch | 47210 | tonnes | 1996 | | Catch | 42465 | tonnes | 1997 | | Catch | 35060 | tonnes | 1998 | | Catch | 40163 | tonnes | 1999 | | Catch | 42109 | tonnes | 2000 | | Catch | 36675 | tonnes | 2001 | | Catch | 40107 | tonnes | 2002 | | Catch | 45272 | tonnes | 2003 | | Catch | 48969 | tonnes | 2004 | | Catch | 51226 | tonnes | 2005 | | Catch | 43283 | tonnes | 2006 | | Catch | 47219 | tonnes | 2007 | | Catch | 50987 | tonnes | 2008 | | Catch | 69408 | tonnes | 2009 | | Catch | 82777 | tonnes | 2010 | | Catch | 101696 | tonnes | 2011 | | Catch | 98357 | tonnes | 2012 | | Catch | 93639 | tonnes | 2013 | | Catch | 99853 | tonnes | 2014 | | Catch | 103490 | tonnes | 2015 | | Catch | 121847 | tonnes | 2016 | | Catch | 112057 | tonnes | 2017 | | Catch | 96705 | tonnes | 2018 | | Catch | 87238 | tonnes | 2019 |
Management Management unit: Yes Sources ICES Advice accessed through ICES Stock Assessment Database in 2020. ICES, Copenhagen.  http://standardgraphs.ices.dk/ViewCharts.aspx?key=13749 http://standardgraphs.ices.dk/ViewCharts.aspx?key=13749 |
|
| |
|