Results
The last stock assessment for North Pacific albacore completed in 2020 by the Albacore Working Group (ALBWG) of the International Scientific Committee for Tuna and Tuna-like Species in the North Pacific Ocean (ISC) (
ISC/20/Annex/12,
SAC-11-INF-I). A new assessment is planned for 2023. The north Pacific albacore tuna stock has been exploited for a long time, the catches were the highest in 1976 (about 127,000 t) and the lowest in 1991 (about 37,000 t). During the assessment period (1994-2018), the highest catches were in 1999 (about 119,000 t) and the lowest in 2018 (about 57,600 t). About 2/3 of the catches come from surface fisheries (troll and pole-and-line) that harvest mainly juveniles, and the rest from longline fisheries.
The assessment was done using the “best model” approach. The working group concluded that the stock was not experiencing overfishing and was probably not overfished (Figure F-3)
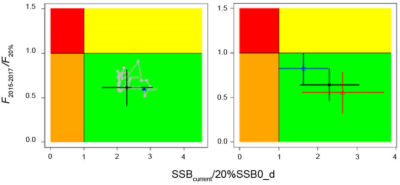 |
Figure F-3 Kobe plot showing the status of the north Pacific albacore (Thunnus alalunga) stock relative to the 20% of the dynamic spawning biomass with no fishing and corresponding fishing intensity (F20%), with 95% confidence intervals: (A) Base-case trajectory (start year, 1994, is a triangle and terminal year, 2018, is a circle). (B) Final year for base-case model (black), sensitivity model with different growth assumptions (blue), update of the 2017 model to 2020 data (red) (SAC-11-INF-I).  |
(
Table F-1). The current depletion is 0.46 (
SSB2018/SSB_d, where
SSB_d is the dynamic spawning stock biomass without fishing for 2018). The ratio of SSB
2018/
SMSY = 3.01. The relative current fishing mortality is
F2015-2017/
F50%= 1,
F2015-2017/
F20% =0.62,
F2015-2017/
FMSY =0.60 (Table F-1). Ten years projections with either constant catch (average of 2013-2017, 69,000 t) or constant fishing mortality (at the
F2015-2017 level) predicted an increase in the female spawning biomass.
The current IATTC conservation and management measures for north Pacific albacore (Resolutions
C-05-02,
C-13-03 and
C-18-03) are based on maintaining the fishing effort below the 2002-2004 levels. The effort levels in eastern Pacific Ocean for 2018-2020 were 63% and 65% of those in 2002-2004, for vessel-days and number of vessels respectively, and are showing a declining trend in the last 10 years (Figure F-2).
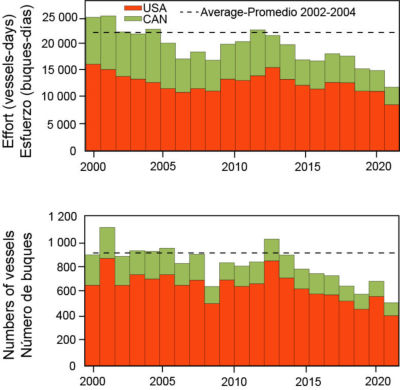 |
| Figure F-2: Effort in vessel-days and number of vessels for the North Pacific albacore tuna in the eastern Pacific Ocean. |
The Working Group finished a Management Strategy Evaluation (MSE) for the North Pacific albacore stock and presented the results to the stakeholders in regional workshops. The first round of the MSE was concluded and reported during the 4
th ISC ALB MSE workshop in March 2019 (
ISC/19/ANNEX/06). Several operating models were developed, and equal weights were assumed for all alternative operating models when evaluating the harvest control rules, HCRs. Additional work was conducted in a second round of the MSE, when mixed control rules were tested (under mixed control, longline fleets are subject to a total allowable catch, TAC, whereas surface fleets are managed with a total allowable effort, TAE) and the effect of a “ghost fleet” (a fleet with undeclared catch) was evaluated. The results of the MSE were included in a recorded presentation for the SAC-12 meeting (
SAC-12 INF-C,
SAC-12-INF-C presentation) and were presented at the 2021 ISC plenary (
ISC).
The following management objectives for the North Pacific albacore tuna were developed in the context of the MSE process and were adopted by the IATTC in 2020 (IATTC-95).
Overarching objective: maintain the viability and sustainability of the current NPALB stock and fisheries.
1. Maintain spawning biomass above the limit reference point
2. Maintain total biomass, with reasonable variability, around the historical average depletion of total biomass
3. Maintain harvest ratios by fishery (fraction of fishing impact with respect to SSB) at historical average
4. Maintain catches by fishery above average historical catch
5. If a change in total allowable effort and/or total allowable catch occurs, the rate of change should be relatively gradual
6. Maintain F at the target value with reasonable variability
The MSE process included input from managers and stakeholders and extensive simulation work. Candidate harvest control rules (HCRs) were suggested by managers and stakeholders. All HRCs are based on inputs from the assessment model and included target, limit, and threshold reference points, all based on dynamic quantities that take into consideration temporal variation in selectivity and recruitment. Based on the estimated status of the stock, the HRC specifies whether a management action to control fishing is needed. The management actions tested were mixed control or Total Allowable Catch (TAC). Under mixed control, surface fisheries (EPO troll and pole-and-line, and Japanese pole-and-line) are managed via effort control, while longline fisheries are managed via a TAC.
Sixteen HCRs were tested under several scenarios ranging from low to high productivity of the stock, of which four (which were deemed a good representation of the plausible mechanisms operating in the population) were retained to present the results. The performance of the HCRs under those scenarios was measured through indicators consisting of quantitative representations of the overall management objectives adopted for the fishery.
The main results of the MSE were (
ISC/21/ANNEX/11):
1. All HCRs were able to maintain the stock above the level considered undesirable (
i.e., above WCPFC’s limit reference point (20% SSB0), the IATTC limit reference point used for tropical tunas (7.7% SSB0)), with more than 92% probability (for mixed controls) or 86% probability (for TAC control), even in the event of undeclared catches from an unknown fleet.
2. For all HCRs, mixed control maintained higher and less variable stock biomass than TAC control as the catches of surface fleets under effort control responded quickly to changes in biomass and their catch levels were not impacted by assessment errors in biomass estimates. Mixed control performs better under all indicators in the scenario of low productivity than TAC controls.
3. HCRs with the LRP and SSB
threshold reference points closer to the SSB associated with TRP resulted in a higher frequency of management interventions (that is, HCRs with 30% SSB0 as threshold and
F50%SSB as target, and HCRs 20% SSB0 as threshold and
F40%SSB as target).
4. HCRs that used
F40%SSB as TRP produced more variable catches (but higher median catches) than HCRs that used
F50%SSB under TAC control.
In addition, the results of adding a ghost fleet showed that all HCRs succeeded in maintaining the stock at healthy levels, but the catches of the other fleets decreased to compensate for the increase in fishing mortality.
The next step in the MSE process is the adoption of a HCR by the Commission in coordination with the Western and Central Pacific Fisheries Commission taking into account the performance of the tested HCRs to fullfil the management objectives.
The staff will work with the ALBWG to complete the 2023 stock assessment of North Pacific albacore tuna.