Skipjack tuna - Eastern Pacific|
| Fact Sheet Title Fact Sheet |
| | | Skipjack tuna - Eastern Pacific |
| | Data Ownership | | This document provided, maintained and owned by Inter-American Tropical Tuna Commission (IATTC) , is part of IATTC Stock Status Reports data collection. |
| | ident Block | ident Block | | | | Species List: | | Species Ref: en - Skipjack tuna, fr - Listao, es - Listado, zh - 鲣, ru - Тунец полосатый (=скипджек) |
|
|
| ident Block Skipjack tuna - Eastern Pacific Map tips - Click on
 to turn layers on and off to turn layers on and off - Double-click to zoom in
- Drag to pan
- Hold down the shift key and drag to zoom to a particular region
| pac Tuna Rep |
|---|
| EPO | East Pacific Ocean |
|---|
|
|
|
|
| | Aq Res | Biological Stock: Yes Value: Regional
Management unit: Yes Reference year: 2021
|
| Considered a management unit: An aquatic resource or fishery is declared as [Fishery] Management Unit if it is effectively the focus for the application of selected management methods and measures, within the broader framework of a management system. According to the FAO Glossary for Responsible Fishing, "a Fishery Management Unit (FMU) is a fishery or a portion of a fishery identified in a Fishery Management Plan (FMP) relevant to the FMP's management objectives." FMU's may be organised around fisheries biological, geographic, economic, technical, social or ecological dimensions , and the makeup and attribute of a fishery management unit depends mainly on the FMP's management objectives. |
| Jurisdictional distribution: Jurisdictional qualifier (e.g. "shared", "shared - highly migratory") of the aquatic resource related with its spatial distribution. |
| Environmental group: Classification of the aquatic resource according to the environmental group (e.g. pelagic invertebrate, or demersal fish) to which the species belong. |
| Reference Year: The Reference Year is the last year considered in the stock assessment and/or fishery status. |
| | | | | | Habitat Bio Bottom Type: Unspecified. Depth Zone: Abyssal ( >1000m). Horizontal Dist: Oceanic. Vertical Dist: Pelagic. Geo Dist Geo Dist: Highly migratory Water Area Overview  | | Water Area Overview Skipjack tuna - Eastern Pacific
| pac Tuna Rep | EPO: East Pacific Ocean |
| | | | | | Water Area Overview |
Water Area OverviewSkipjack tuna - Eastern Pacific Aq Res Struct Biological Stock: Yes Exploit The annual catches of skipjack during 1992-2021 are shown in ( Table A-1). Most of the catch is taken in the WCPO. Prior to 1998, WCPO catches averaged about 900 thousand t; subsequently, they increased steadily, from 1.1 million t to an all-time high of 2 million t in 2019. In the EPO, the greatest catches occurred between 2005 and 2021, ranging from 153 to 365 thousand t, the record catch in 2019. The annual retained catches of skipjack in the EPO, by gear, during 1992-2021 are shown in ( Table A-2a). During 2006-2020 the annual retained purse-seine and pole-and-line catch averaged 279 thousand t (range: 147 to 347 thousand t). The preliminary estimate of the retained catch in 2021, 325 thousand t, is 16% greater than the 15-year average for 2006-2020. Discards of skipjack at sea decreased each year during the period, from 4% in 2006 to a low of less than 1% in 2018, averaging about 1.5% of the total catch of the species (Table A-2a). Catches of skipjack in the EPO by longlines and other gears are negligible (Table A-2a). See also fishery fact sheet: EPO Tunas and billfishes fishery | Figure C-1: Total catches (retained catches plus discards) for the purse-seine fisheries, by set type (NOA, OBJ) and retained catches for the other (OTR) fisheries, of skipjack tuna in the eastern Pacific Ocean, 1975- 2021. The purse-seine catches are adjusted to the species composition estimate obtained from sampling the catches. The 2020 catch data are preliminary.  |
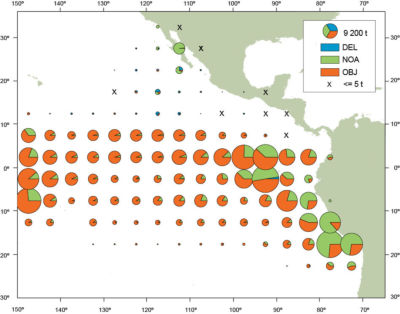 | | Figure A-2a: Average annual distributions of the purse-seine catches of skipjack, by set type, 2016-2020. The sizes of the circles are proportional to the amounts of skipjack caught in those 5° by 5° areas. |
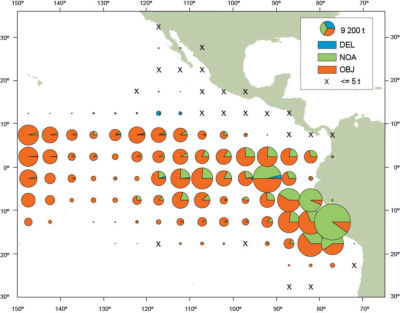 | | Figure A-2b: Annual distributions of the purse-seine catches of skipjack, by set type, 2021. The sizes of the circles are proportional to the amounts of skipjack caught in those 5° by 5° areas. |
Bio Assess Assess Models Type: Age-structured An integrated statistical age-structured stock assessment model, Stock Synthesis An integrated statistical age-structured catch-at-length stock assessment was developed for skipjack tuna in the eastern Pacific Ocean using Stock Synthesis. The assessment is similar to those conduced for bigeye and yellowfin tuna and is fit to indices of relative abundance and length-composition data. Although the assessment is termed interim by the staff, the staff considers it reliable for management advice. The term interim results from additional improvements being expected on the skipjack assessment under the ongoing workplan to develop a stock assessment for skipjack in the EPO that includes tagging data. Data Skipjack tuna are distributed in tropical waters across the Pacific Ocean. In the eastern Pacific Ocean (EPO), the majority of catch is taken by the purse seine fishery. Since 1990 the purse-seine fishery associated with floating objects has become the dominant fishery type (Figure C-1) 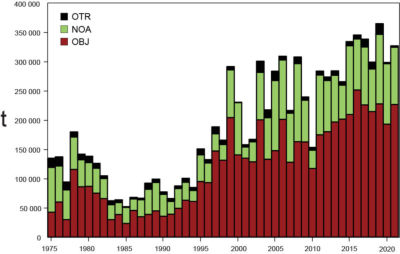 | | Figure C-1: Total catches (retained catches plus discards) for the purse-seine fisheries, by set type (NOA, OBJ) and retained catches for the other (OTR) fisheries, of skipjack tuna in the eastern Pacific Ocean, 1975- 2021. The purse-seine catches are adjusted to the species composition estimate obtained from sampling the catches. The 2020 catch data are preliminary. |
Results Assess Indicator Type: Abundance MSY-based quantities cannot be estimated because the tradeoff between growth and natural mortality, in combination with the assumption that recruitment is independent of stock size, implies fish should be caught at the youngest ages to maximize yield, implying that the optimal fishing mortality should be infinite. Therefore, a conservative proxy for the target biomass of SBR = 0.3 based on values for bigeye and yellowfin, and the fishing mortality corresponding to that biomass, are used as the target reference points. The reference model estimated that the 2021 exploitation rate was slightly above status quo (average level of 2017-2019; Figure C-2), 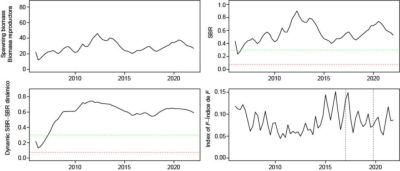 | | Figure C-2: Spawning biomass, spawning biomass ratio, dynamic spawning biomass ratio, and an index of quarterly exploitation rate for the reference model. The green dashed horizontal line is the target biomass reference point (SBR = 0.3) and the red horizontal dashed line is the limit biomass reference point (SBR = 0.077). The two vertical lines represent the status quo period (2017-2019). |
as did over half of the sensitivity models ranging from being only slightly above to being 0.1 higher (except one model that estimated high exploitation rates; Table C-1) ( Table C-1). The reference model and most of the sensitivity analyses estimate that the current biomass is above the target reference point and the fishing mortality is below the target fishing mortality (Figure C-3, Table C-1). 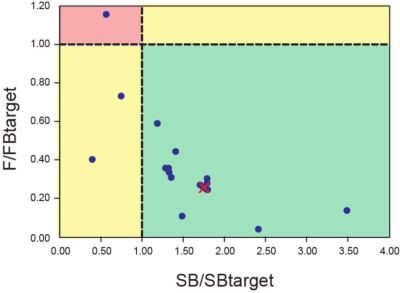 | | Figure C-3: Kobe plot showing the stock status estimates from all the models. |
Bio Assess Results There is substantial uncertainty about several model assumptions and sensitivity analyses are conducted to determine if the management advice is robust to the uncertainty. In particular, there is uncertainty about why the large skipjack are not seen in the purse-seine fishery. This could be due to dome-shaped selectivity, high fishing mortality, high natural mortality for old fish, or a rapid decline in growth rates for older fish. Several data sources are available to fit the model, but there is uncertainty about their reliability. Sensitivity analyses are conducted to determine if the management advice is robust to the use of the different data sources. Relative indices of abundance include: a) a longline index, for which the sample size is low; b) catch-per-set indices for purse-seine sets, by set type (floating objects, free swimming schools), for which the relationship between catch-per-set and abundance is uncertain; and, c) an index based on echosounder buoy data, which has recently been developed. A reference model is developed based on the most plausible assumptions and sensitivity analyses are conducted by changing the assumptions of the reference model. The diagnostics indicate that a data conflict exists, and that this was reduced somewhat when the stock east of 120°W was assessed separately. However, the management results were robust to the inclusion or exclusion of the index of abundance and length-composition data sets. The model will continue to be improved towards the benchmark assessment in 2024, including incorporating the results of the analysis of recently collected tagging data. Management Management unit: Yes Sources Inter-American Tropical Tuna Commission (IATTC). “Report on tuna fishery, stocks, and ecosystem in the Eastern Pacific Ocean in 2021. Inter-American Tropical Tuna Commission. Fishery Status Report. IATTC 2022.”  https://www.iattc.org/GetAttachment/6aff9a86-590c-4f24-b13b-a929eb4065df/IATTC-100-01_The-tuna-fishery,-stocks,-and-ecosystem-in-the-Eastern-Pacific-Ocean-in-2021-(1).pdf https://www.iattc.org/GetAttachment/6aff9a86-590c-4f24-b13b-a929eb4065df/IATTC-100-01_The-tuna-fishery,-stocks,-and-ecosystem-in-the-Eastern-Pacific-Ocean-in-2021-(1).pdf |
|
| |
|
|