Skipjack tuna - East Atlantic|
| Fact Sheet Title Fact Sheet |
| | | Skipjack tuna - East Atlantic |
 | Skipjack tuna - East Atlantic |
| | Data Ownership | | This document owned by International Commission for the Conservation of Atlantic Tunas (ICCAT), provided and maintained by Standing Committee on Research and Statistics , is part of ICCAT SCRS Reports data collection. |
| | ident Block | ident Block | | | | Species List: | | Species Ref: en - Skipjack tuna, fr - Listao, es - Listado, zh - 鲣, ru - Тунец полосатый (=скипджек) |
|
|
| ident Block Skipjack tuna - East Atlantic Map tips - Click on
 to turn layers on and off to turn layers on and off - Double-click to zoom in
- Drag to pan
- Hold down the shift key and drag to zoom to a particular region
| iccat Smu |
|---|
| SKJ_E | East Atlantic and Mediterranean Sea |
|---|
|
|
|
|
| | Aq Res | Biological Stock: Yes Value: Regional
Management unit: Yes Reference year: 2013
|
| Considered a management unit: An aquatic resource or fishery is declared as [Fishery] Management Unit if it is effectively the focus for the application of selected management methods and measures, within the broader framework of a management system. According to the FAO Glossary for Responsible Fishing, "a Fishery Management Unit (FMU) is a fishery or a portion of a fishery identified in a Fishery Management Plan (FMP) relevant to the FMP's management objectives." FMU's may be organised around fisheries biological, geographic, economic, technical, social or ecological dimensions , and the makeup and attribute of a fishery management unit depends mainly on the FMP's management objectives. |
| Jurisdictional distribution: Jurisdictional qualifier (e.g. "shared", "shared - highly migratory") of the aquatic resource related with its spatial distribution. |
| Environmental group: Classification of the aquatic resource according to the environmental group (e.g. pelagic invertebrate, or demersal fish) to which the species belong. |
| Reference Year: The Reference Year is the last year considered in the stock assessment and/or fishery status. |
| | | | | | History Stock assessments for East and West Atlantic skipjack were conducted in 2014 (Anon. 2014) using catch data available to 2013. The last assessment of skipjack stocks was only conducted in 2008 (Anon. 2009a). Consequently, this report covers the most recent information on the state of the stocks on this species. Habitat Bio Climatic Zone: Tropical. Vertical Dist: Pelagic. Skipjack tuna is a gregarious species that is found in schools in the tropical and subtropical waters of the three oceans (Figure 1). Skipjack is the predominant species aggregated to FADs where it is caught in association with juvenile yellowfin tuna, bigeye tuna and with other species of epipelagic fauna. Skipjack reproductive potential is considered to be high because it reaches sexual maturity around one year and it spawns opportunistically in warm waters above 25ºC throughout the year and in large areas of the ocean. Moreover, the analysis of East Atlantic tagging data has confirmed that the growth of skipjack was quicker in sub-tropical waters than in equatorial waters where it produces most of its spawn. These growth differences depending on latitude must be taken into account if the assessments are carried out on separate stocks between sub-tropical and tropical areas. It is also possible that the growth does not follow the conventional Von Bertalanffy model but rather a two-stanza model. Based on the relationships between life history characteristics and natural mortality, a natural mortality vector decreasing with size has been estimated (Figure 2). The natural mortality values estimated by this approach are greater than those used to date for East Atlantic skipjack. Lower values have been obtained by another approach which has been applied for the western stock, whose catches are however composed of larger sized individuals than in the eastern stock. The increasing use of fish aggregation devices (FADs) since the early 1990s, have changed the species composition of free schools. It is noted that, in fact, the free schools of mixed species were considerably more common prior to the introduction of FADs. Furthermore, the association with FADs may also have an impact on the biology (growth rate, plumpness of the fish) and on the ecology (distances, movement orientation) of skipjack and yellowfin (“ecological trap” concept). 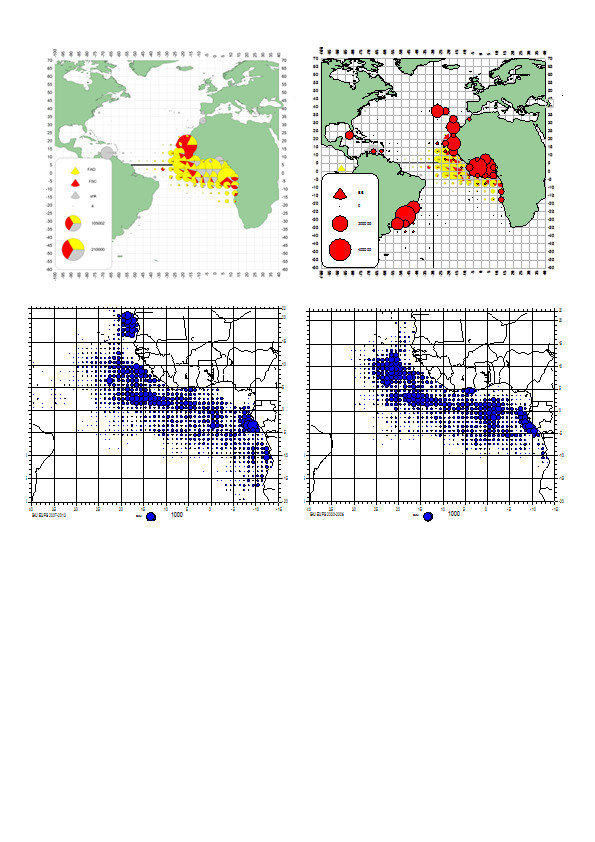 | Figure 1. Distribution of skipjack catches in the Atlantic for baitboat (upper left panel) between 1950 and 2013 and for purse seiners (upper right panel) by fishing mode (free schools vs. FADs) between 1991 and 2013. Skipjack catches made by European and associated purse seiners (about 75% of the total catches) between 2000 and 2006 (lower left panel) and between 2007 and 2013 (lower right panel) showing the withdrawal from the Senegal fishing zone on free schools, due to non-renewal of the fishing agreements in 2006, and the appearance of a fishing area under FADs in 2012 North of 15oN latitude.  |
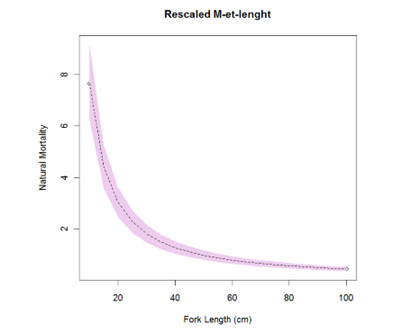 | | Figure 2. Estimates of natural mortality by size of Atlantic skipjack calculated by empirical relationships between mortality and some biological parameters (which show different values from those traditionally used in the East. |
Geo Dist Geo Dist: Highly migratory Skipjack tuna is a gregarious species that is found in schools in the tropical and subtropical waters of the three oceans (Figure 1) Water Area Overview  | | Water Area Overview Skipjack tuna - East Atlantic
| iccat Smu | SKJ_E: East Atlantic and Mediterranean Sea |
| | | | | | Water Area Overview |
Water Area OverviewSkipjack tuna - East Atlantic Aq Res Struct Biological Stock: Yes During the 2009 assessment the Committee reviewed the current stock structure hypothesis that consists of two separate management units, one in the East Atlantic and another in the West Atlantic, separated at 30ºW. The boundary of 30ºW was established when the fisheries were coastal, whereas in recent years the East Atlantic fisheries have extended towards the west, surpassing this longitude, and showing the presence of juvenile skipjack tuna along the Equator, west of 30ºW, following the drift of the FADs. This implies the potential existence of a certain degree of mixing . Also some biological parameters, like growth, show differences depending on latitude, which could indicate separate stocks between sub-tropical and tropical areas. Based on the large geographic distances between the fishing areas and current knowledge on small-scale migrations of skipjack in the Atlantic (Figure 1), the Committee has analysed the possibility of using smaller stock units. Nevertheless, the Committee does not currently have evidence, such as a sufficient amount of tag-recovery data covering the entire tropical ocean, in order to validate smaller stock units. Consequently, the Committee has decided to maintain the working hypothesis which favours two different units of eastern and western stocks but on an experimental basis to assess a sub-unit in each of the two stocks. The use of smaller areas has however been recommended to monitor the development over time of fishery indicators. Exploit Fishery IndicatorsFollowing the historic record in 2012 (258,300 t), the total catches of skipjack throughout the Altantic Ocean (including catches of "faux poisson" landed in Côte d’Ivoire) remain high at 221,600 t ( Table1, Figure 3) This represents a very sharp rise compared to the average catches of the five years prior to 2010 (157,600 t). It is possible, however, that the catches of a segment of the Ghanaian purse seine fleet, transshipped at sea on carriers, have escaped the fishery statistics collection process before 2011. In addition, following the expert missions carried out in Ghana which have shown the existence of bias in the sampling protocol which aims to correct the multi-species compositions of the catches reported in the logbooks, Ghanaian Task I and II statistics have been reviewed in several stages (1973-2005). The last review for the period 2006-2012 shows that the skipjack catches reported by Ghana were underestimated by around 28%, which gives an average of 12,000 t/year. Therefore, all of these historical data have consequently been corrected. The numerous changes that have occurred in the skipjack fishery since the early 1990s (e.g. the progressive use of FADs and the latitudinal expansion and the westward extension of the fishing area) have brought about an increase in skipjack catchability and in the proportion of biomass exploited. Currently, the major fisheries are the purse seine fisheries, particularly those of EU-Spain, Ghana, Curaçao, Belize, Panama, EU-France, Guinea and Cape Verde, followed by the baitboat fisheries of Ghana, EU-Spain, EU-Portugal and Senegal. The preliminary estimates of catches made in 2013 in the East Atlantic amounted to 203,500 t, which is an increase of about 54% as compared to the average of 2005-2009 (Figure 4). It should be noted that there has been a sharp increase in the skipjack catches by the European purse seiners, probably due to the high selling price of this species since 2011 (Figure 5). This increase in catches is accompanied by changes in fishing strategies since the proportion of skipjack catches using floating objects has continued to increase. This is the result to some extent of the sharp reduction in seasonal fishing by European purse seiners on free schools after 2006 off the coast of Senegal and of the emergence as from 2012 of atypical fishing off FADs – since it involves single-species schools composed of large individuals – between August and November off the coast of Mauritania (Figure 1). These changes in fishing strategy can take place differently in the purse seine fleets, including in fleets that operated similarly in the past (Figure 6) and are therefore difficult to integrate into stock assessment models. The unreported catches of some purse seiners were estimated by comparing the monitored landings in West African ports and cannery data to the catches reported to ICCAT. Estimates of the unreported catches of these purse seiners have increased since 2006 and may have exceeded 20,000 tons for the three main species of tropical tunas. The Committee expressed the need for the countries and the industry concerned in the region to cooperate to estimate and report these catches accurately to ICCAT. Recent progress in the transmission and review of data submitted to the ICCAT Secretariat has enabled the Committee to partially include these catches and the associated sizes in the skipjack assessment. The magnitudes of these estimates of IUU catch, however, are likely to influence the assessments and the perception of stock status. The average rate of discards of skipjack on FADs by European purse seiners operating in the eastern Atlantic has been estimated based on onboard observer programmes implemented in 2001 to be 42 kg per t of skipjack landed. Furthermore, the amount of small skipjack (average size 37 cm FL) landed in the local market of Abidjan in Côte d’Ivoire as "faux-poisson" has been estimated at 235 kg per t of skipjack landed (i.e. an average of 6,641 t/year between 1988 and 2007 for the European or associated purse seiners, Figure 7). However, the latest estimates indicate values close to 10,500 t/year between 2005 and 2013 for all purse seiners operating in the eastern Atlantic (skipjack representing around 30% of the total “faux-poisson”). The Committee regularly incorporates these estimates into the reported historical catches for the EU purse seiners since 1982, as well as in the catch-at-size matrix. It is difficult to discriminate a fishing effort for free schools (composed of large yellowfin tunas) for FAD fishing (targeting skipjack) in the East Atlantic because the fishing strategies can change from one year to the next and in addition, the sea time devoted to activities on FADs and the assistance provided by supply vessels are difficult to quantify. The Committee recognizes that the use of data series on the yearly progression of the sale prices of tropical species by commercial category enables identification of the years when skipjack is most targeted by the purse seiners (which seems to be the case in the past few years, Figure 6). Nominal purse seine effort, expressed in terms of carrying capacity, has decreased regularly since the mid 1990s up to 2006. However, after this date, several European Union purse seiners have transferred their effort to the East Atlantic, due to piracy in the Indian Ocean, and a fleet of new purse seiners have started operating from Tema (Ghana), whose catches are probably underestimated. All this has contributed to the growth in carrying capacity of the purse seiners, which is gradually nearing the level observed in the early 1990s (Figure 8). The number of purse seiners follows this trend but seems to have remained steady since 2010; the nominal effort of baitboats has remained stable for over 20 years. It is recognised that the increase in fishing power linked to the introduction of technological innovation on board the vessels as well as to the development of fishing using floating objects has resulted in an increase in the efficiency of the various fleets, since the early 1980s. In order to take into account the effect of the technological changes in skipjack catchability, an annual yearly growth of 3% is generally assumed as the working hypothesis, although an analysis carried out fixing the MSY and K at the values estimated in the previous stock assessment would suggest an increase in catchability between 1 and 13% per year. Moreover, the estimates on growth in bigeye catchability, whose juveniles are also captured using FADs, would indeed indicate a value of 2.5% per year before 1991 and 6 to 8% thereafter. However, it is not known whether these estimates only reflect technological changes, or the availability of fish as well, resulting from the expansion of the surface area exploited over the years, reaching its historic high in 2013 and which corresponds to the expansion of the fishery towards the West Central Atlantic or more recently to the level of the North and South latitudes (Figure 9). The increase in total mortality (Z) between the early 1980s and the late 1990s, estimated using different methods, such as the tag-recovery model, the catch curves by size and the average size observed in the yearly catches, is consistent with an increase in catchability. The steady decrease in average weight up to 2011 (Figure 10) is also consistent with the fact that the purse seine fleet has increased pressure on juvenile tunas. This trend has reversed since 2012 and at the same time a broadening of the range of sizes caught is observed (Figure 11). Generally, except the East Pacific, it has been noted that the average skipjack weight observed in the East Atlantic (close to 2 kg) was much lower than the estimates provided for the other oceans (close to 3 kg). 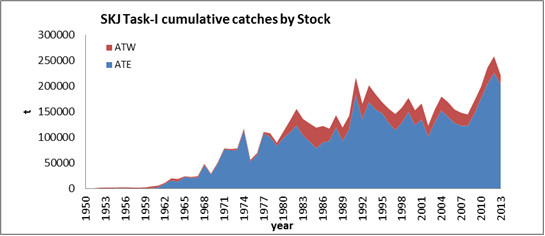 | | Figure 3. Total skipjack catches (t) in the Atlantic and by stock (East and West) between 1950 and 2013. Skipjack estimates in the faux poissons landed in Côte d’Ivoire were included in the skipjack trade catches in the eastern Atlantic. It is possible that skipjack catches taken in the eastern Atlantic in recent years were not reported or were under-estimated in the logbook correction of species composition based on multi-species sampling carried out at the ports. The 2013 figure is still preliminary, in particular for the East Atlantic. |
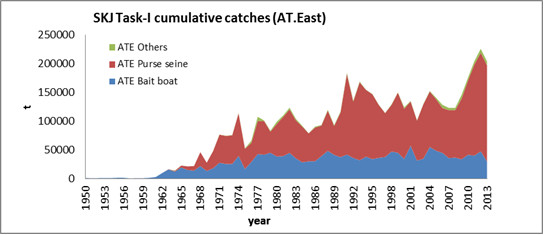 | | Figure 4. Cumulative skipjack catches in the eastern Atlantic, by gear (1950-2013), after correction of Ghana’s data by species (1996-2012). |
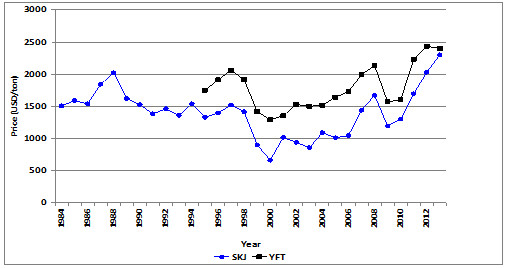 | | Figure 5. Average prices of skipjack and yellowfin in U.S. dollars (adjusted for inflation and converted into the value of the 2013 $US) in the Bangkok market. |
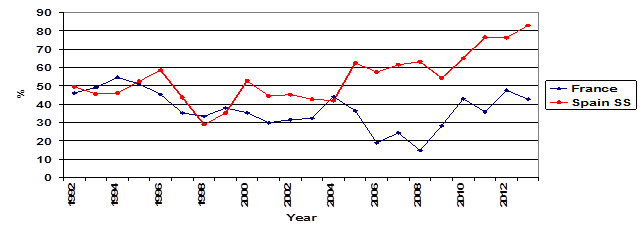 | | Figure 6. Changes in the proportion of skipjack catches made by French and Spanish purse seiners under FADs (1991-2013). The increase in the percentage of catches under FADs coincides with the shift from the Senegal area, known for its seasonal fishing on free schools (see Figure 1), and with the increase of skipjack prices. |
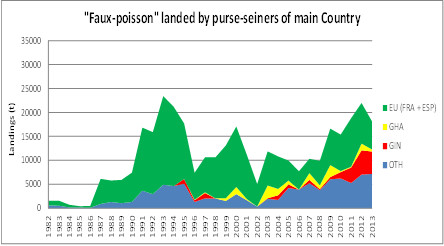 | | Figure 7. Cumulative estimated landings of faux poissons (1981-2013) for the European or associated purse seiners for the three major species of tropical tunas in the local market of Abidjan (Côte d'Ivoire). |
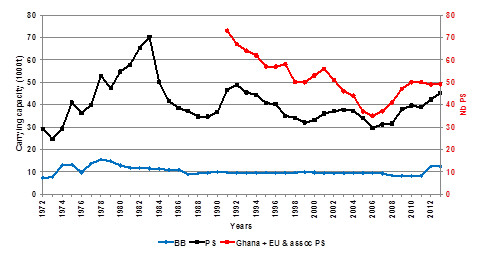 | | Figure 8. Changes over time in the carrying capacity, corrected by the annual percentage of time at sea, (left axis) for the overall purse seiners and baitboats operating in the eastern Atlantic (1971-2013) and in number of boats for the European purse seiners, associated and Ghanaian fleets (right axis). It is possible that the carrying capacity for some segments of the purse seine fleet was underestimated during recent years. |
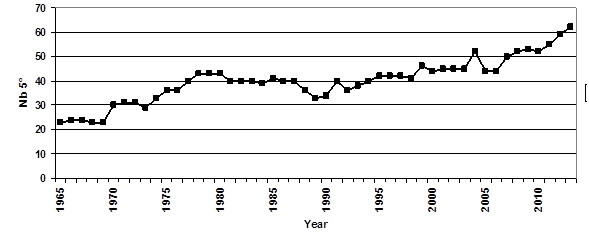 | | Figure 9. Number of 5°x5° squares with annual skipjack catches above 10 t for the European and associated purse seiners operating in the eastern Atlantic (1969-2013). The great increase observed in 1991 could be due to a modification of the species composition correction procedure of the catches implemented at this date (skipjack catches could have been attributed to squares which were not included until then). On the other hand, the recent increase in the area searched successfully corresponds to the extension of the fishery towards the western central Atlantic and off Mauritania and Angola. |
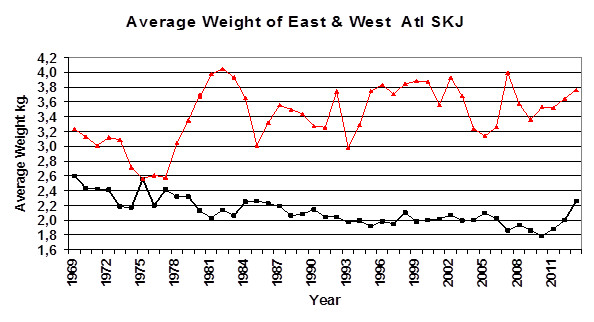 | | Figure 10. Changes in the average weight of skipjack in the eastern (black) and western Atlantic (red). |
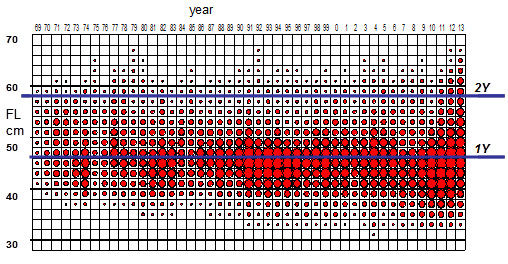 | | Figure 11. Annual catch (in weight) by skipjack size class in the eastern Atlantic and approximate size limits of ages 1 and 2 (blue). The size at first sexual maturity (50%) is estimated at 42 cm. |
Bio Assess Assess Models In all the oceans, the traditional stock assessment models are difficult to apply to skipjack because of their particular biological and fishery characteristics (on the one hand, continuous spawning, spatial variation in growth and on the other, discrimination of effort for free schools and FADs, transition between these two fishing methods which are difficult to quantify). In order to overcome these difficulties, several assessment methods, conventional and non-conventional (based solely on catches, or on development of average size) have been applied to the two stocks of Atlantic skipjack. Several fishery indicators have also been analysed in order to track the development of the state of the stock over time. Based on the large geographic distances between the fishing areas and current knowledge on small-scale migrations of skipjack in the Atlantic (Figure 1 and Figure 12), the Committee has also analysed the possibility of using smaller stock units. While recognising the validity of this approach, the Committee does not currently have evidence, such as a sufficient amount of tag-recovery data covering the entire tropical ocean, in order to validate smaller stock units. Consequently, the Committee has decided to maintain the working hypothesis which favours two different units of eastern and western stocks but on an experimental basis to assess a sub-unit in each of the two stocks. The use of smaller areas has however been recommended to monitor the development over time of fishery indicators. The Committee has analysed two standardized fishery indices from the EU-purse seine fishery: an index which accounts for skipjack caught in free schools off the coast of Senegal up to 2006 and the second index which characterises fish captured off FADs and in free schools in the equatorial area (Figure 13). The increase in CPUE of the European purse seiners in the late 1990s is partly the consequence of the increase in the catches of positive sets under FADS, in particular for Spanish vessels since 2011 (Figure 14). In addition, the introduction of the price of skipjack (price adjusted for inflation) into the standardisation of the CPUE has not improved the fit. Furthermore, the regular increase in the skipjack yields of the baitboats based in Senegal may only be the result of an increase in catchability linked to the adoption of the so-called “baitboat associated school” fishing towards the mid 1980s (Figure 13). No marked trend has been observed for the Canary Islands baitboats, nor for the peripheral fishery of the Azorean baitboat fishery. Although the Committee has only considered a single stock for the East Atlantic, due to the very low apparent exchange rates between the sectors (based on available information, only 0.9% of tagged fish on both sides of the latitude 10ºN have exceeded this limit), a decrease in abundance for a local segment of the stock would probably have little repercussion on abundance in other areas (refer to notion of stock viscosity). Regardless of the model used: 2 surplus biomass production models (one non-equilibrium conventional model, and one Bayesian model), a model based only on catch and a mortality estimation model based on the average sizes of fish captured, the Committee was not in a position to provide a reliable estimate of the maximum sustainable yield and therefore nor provide advice on the state of the eastern stock. This applies in the Bayesian case, (1) after testing different working hypotheses on the a priori distribution of the input parameters of the surplus production model (i.e. the growth rate and the carrying capacity), and on the impact of the growth of the catchability coefficient on the CPUE of each fleet), and (2) after performing a retrospective analysis in the case of the catch-only based model. The absence of definition of a fishing effort associated with FADs for the purse seiners, the difficulty of taking into account changes in catchability, the lack of marked contrast in the datasets despite the historical development of the fishing pressure (Figure 8) and the fact that the catches and the CPUEs have increased in parallel in recent years are constraints for effective use of the classic stock assessment methods. The Committee has also highlighted that it is difficult to estimate the MSY in conditions of continuous growth of catches without having reliable indicators on the response of the stock to these increases. These indicators may be improved CPUE series, fishing mortality estimates from tagging programmes or other indicators on the exploitation of this species. . Even if caution must be exercised when formulating a diagnosis on the state of the stock in the absence of quantification by an adequate approach, there is no evidence of a fall in yield, or in the average weight of individuals captured (Figure 10). The estimated value of the MSY, according to the catch-only assessment model, has tended to increase in recent years but at a growth rate that is lower than that observed for the catches for the same period. However, according to this model, although it is unlikely that the eastern skipjack stock is overexploited, current catches could be at, even above, the MSY. As in the past, it is difficult to know whether this hypothesis can be applied to all spatial components of this stock in the East Atlantic, due to the moderate exchange rates which seem to exist between the different sectors of this region. The Committee considers that the MSY should be higher than that estimated in the 2008 assessment in a different exploitation plot to the current one, but cannot express an opinion on the level of the new MSY and the sustainability of the current catches, nor on the repercussions of this exploitation plot on juveniles of the two other species of tropical tunas. Taking into account the biological and fishery specificities of skipjack, the Committee has attempted to develop Harvest Control Rules based on the proportion of individuals whose sizes are larger than the reference sizes (e.g. size at sexual maturity, the size corresponding to the length which maximises the catches for a given cohort, etc.) The Committee recommends, however, that due to the multi-species nature of the tropical tuna fishery, the HCRs on skipjack take into account the consequences of targeting skipjack on the other two species of tropical tunas. 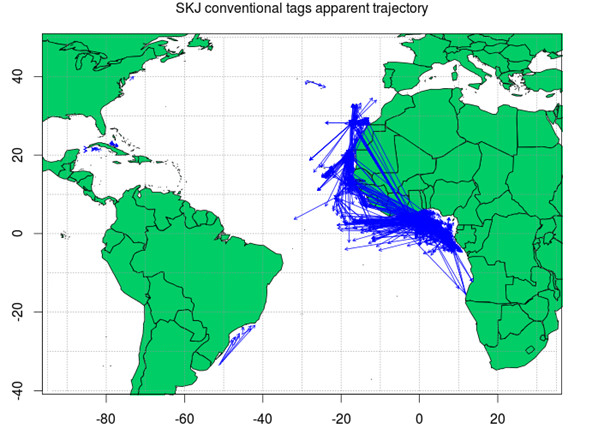 | | Figure 12. Apparent movements (straight line distance between the tagging location and that of recovery) calculated from conventional tagging. |
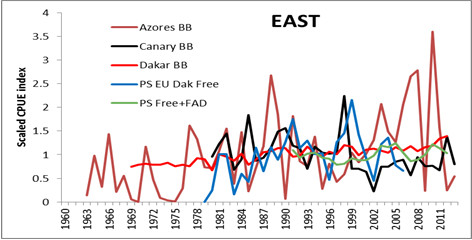 | | Figure 13. Relative abundance indices for the eastern skipjack stock. Each index has been adjusted to its own average level given that to resolve problems regarding scaling, the indices for purse seine have been adjusted to the same level as the Azorean baitboat series. |
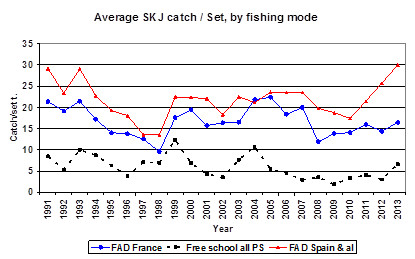 | | Figure 14. Catches by set (t) of eastern Atlantic skipjack and on FADs (France and Spain + associated fleets) and on free schools (all purse seiners). |
Results Projection Outlook The Committee could not determine if the effect of the FADs on the resource is only at local level or if it had a broader impact, affecting the biology and behavior of the species. If this is the case, maintaining high concentrations of FADs could reduce the productivity of the overall stock. Management Management unit: Yes Effects of current regulations There is currently no specific regulation in place for skipjack tuna. Several time/area regulatory measures on banning fishing on FADs [Rec. 98-01] and [Rec. 99-01] or on complete closure to surface fleets [Rec. 04-01] have however been implemented in the East Atlantic but the intended aim was to protect yellowfin and bigeye tuna juveniles. The new Recommendation [Rec. 11-01] which replaces that concerned with the complete closure of the surface fishery [Rec. 04-01] and establishes a new moratorium on FAD fishing in the area that extends from the African coast to 10ºS and 5ºW latitude to 5ºE longitude during the months of January and February, entered into force in 2013. Due to the shift by the European fleet outside the regulated area and the decrease in activity of the Ghanaian purse seiners during the moratorium period, a slight fall in catches of bigeye juveniles has been observed but no significant change has been observed for skipjack and yellowfin tuna. Advice Despite the absence of evidence that the eastern stock is overexploited, but considering (1) the lack of quantitative findings for the eastern stock assessment, and (2) pending the submission of additional data (including on FADs and on the Grand Tropical Tuna Tagging Programme recommended by the Committee), which are necessary to improve the stock assessment, the Committee recommends that the catch and effort levels do not exceed the level of catch in recent years. In addition, the Commission should be aware that increasing harvests and fishing effort for skipjack could lead to involuntary consequences for other species that are caught in combination with skipjack in certain fisheries. Despite recent progress, the Committee has expressed its concern regarding uncertainties which the under-reporting of skipjack catches may have on the perception of the state of the stocks. EAST ATLANTIC SKIPJACK TUNA SUMMARY | Maximum Sustainable Yield | Probably higher than previous estimates (143,000-170,000) | Current (2013) Yield1 | 203,500 t | Current Replacement Yield | Unknown | Relative Biomass (B2013/BMSY) | Likely>1 | Relative Fishing Mortality: F2013/FMSY | Likely<1 | Management measures in effect | Rec. 11-01 2 | 1 Reports of catches for 2013 should be considered provisional, particularly for the West Atlantic.
2 This new moratorium on FADs entered into force in January 2013 and replaces Rec. 04-01. Sources “Report of the 2014 Meeting of the Standing Committee on Research and Statistics.” International Commission for the Conservation of Atlantic Tunas (ICCAT). 2015 ICCAT Report for biennial period, 2014-15 PART I (2014) - Vol. 2 ICCAT  http://www.iccat.int/Documents/BienRep/REP_EN_14-15_I-2.pdf http://www.iccat.int/Documents/BienRep/REP_EN_14-15_I-2.pdf |
|
| |
|
|