|
| Fact Sheet Title Fact Sheet |
| |
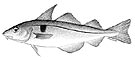
| Haddock - North Sea, Skagerrak and West of Scotland |
 | Haddock (Melanogrammus aeglefinus) in Subarea 4, Division 6.a, and Subdivision 20 (North Sea, West of Scotland, Skagerrak) |
| | Data Ownership | | This document provided, maintained and owned by International Council for the Exploration of the Sea (ICES) , is part of ICES Advice data collection. |
|
| ident Block | ident Block | | | | Species List: | | Species Ref: en - Haddock, fr - Églefin, es - Eglefino, zh - 黑线鳕, ru - Пикша |
Fishery IndicatorsProduction: Landed Volume; Catch |
|
| ident Block Haddock - North Sea, Skagerrak and West of Scotland Map tips - Click on
 to turn layers on and off to turn layers on and off - Double-click to zoom in
- Drag to pan
- Hold down the shift key and drag to zoom to a particular region
| fao Div |
|---|
| 27.6.a | Northwest Coast of Scotland and North Ireland or as the West of Scotland (Division 27.6.a) |
|---|
| fao Sub Div |
|---|
| 27.3.a.20 | Skagerrak (Subdivision 27.3.a.20) |
|---|
| fao Sub Area |
|---|
| 27.4 | North Sea (Subarea 27.4) |
|---|
|
|
|
|
|
| Aq Res | Biological Stock: Yes Value: Sub-Regional
Reference year: 2015 |
| Considered a management unit: An aquatic resource or fishery is declared as [Fishery] Management Unit if it is effectively the focus for the application of selected management methods and measures, within the broader framework of a management system. According to the FAO Glossary for Responsible Fishing, "a Fishery Management Unit (FMU) is a fishery or a portion of a fishery identified in a Fishery Management Plan (FMP) relevant to the FMP's management objectives." FMU's may be organised around fisheries biological, geographic, economic, technical, social or ecological dimensions , and the makeup and attribute of a fishery management unit depends mainly on the FMP's management objectives. |
| Jurisdictional distribution: Jurisdictional qualifier (e.g. "shared", "shared - highly migratory") of the aquatic resource related with its spatial distribution. |
| Environmental group: Classification of the aquatic resource according to the environmental group (e.g. pelagic invertebrate, or demersal fish) to which the species belong. |
| Reference Year: The Reference Year is the last year considered in the stock assessment and/or fishery status. |
| | | | | | Habitat Bio Depth Zone: Shelf (50 m - 200 m). Vertical Dist: Demersal/Benthic. Water Area Overview Spatial Scale: Sub-Regional Water Area Overview  | | Water Area Overview Haddock - North Sea, Skagerrak and West of Scotland
| fao Div | 27.6.a: Northwest Coast of Scotland and North Ireland or as the West of Scotland (Division 27.6.a) | | fao Sub Area | 27.4: North Sea (Subarea 27.4) | | fao Sub Div | 27.3.a.20: Skagerrak (Subdivision 27.3.a.20) |
| | | | | | Water Area Overview |
Water Area OverviewHaddock - North Sea, Skagerrak and West of Scotland | fao Major | 27: Atlantic, Northeast | | Large Marine Ecosystem Areas (LME) | 22: North Sea | | 24: Celtic-Biscay Shelf | | 60: Faroe Plateau |
Aq Res Struct Biological Stock: Yes Exploit Fishery Indicators | Type | Measure | Value | Unit | Time period |
|---|
| Production | Landed Volume | 234019 | tonnes | 1972 | | Landed Volume | 207489 | tonnes | 1973 | | Landed Volume | 167528 | tonnes | 1974 | | Landed Volume | 160271 | tonnes | 1975 | | Landed Volume | 184421 | tonnes | 1976 | | Landed Volume | 156639 | tonnes | 1977 | | Landed Volume | 102970 | tonnes | 1978 | | Landed Volume | 97896 | tonnes | 1979 | | Landed Volume | 111371 | tonnes | 1980 | | Landed Volume | 147806 | tonnes | 1981 | | Landed Volume | 195456 | tonnes | 1982 | | Landed Volume | 188754 | tonnes | 1983 | | Landed Volume | 158205 | tonnes | 1984 | | Landed Volume | 182946 | tonnes | 1985 | | Landed Volume | 185137 | tonnes | 1986 | | Landed Volume | 135022 | tonnes | 1987 | | Landed Volume | 126227 | tonnes | 1988 | | Landed Volume | 92840 | tonnes | 1989 | | Landed Volume | 61605 | tonnes | 1990 | | Landed Volume | 55208 | tonnes | 1991 | | Landed Volume | 81566 | tonnes | 1992 | | Landed Volume | 98631 | tonnes | 1993 | | Landed Volume | 95141 | tonnes | 1994 | | Landed Volume | 89859 | tonnes | 1995 | | Landed Volume | 92615 | tonnes | 1996 | | Landed Volume | 95391 | tonnes | 1997 | | Landed Volume | 95472 | tonnes | 1998 | | Landed Volume | 76009 | tonnes | 1999 | | Landed Volume | 54504 | tonnes | 2000 | | Landed Volume | 47592 | tonnes | 2001 | | Landed Volume | 65405 | tonnes | 2002 | | Landed Volume | 47282 | tonnes | 2003 | | Landed Volume | 51896 | tonnes | 2004 | | Landed Volume | 51528 | tonnes | 2005 | | Landed Volume | 43334 | tonnes | 2006 | | Landed Volume | 34672 | tonnes | 2007 | | Landed Volume | 33058 | tonnes | 2008 | | Landed Volume | 35590 | tonnes | 2009 | | Landed Volume | 31940 | tonnes | 2010 | | Landed Volume | 36570 | tonnes | 2011 | | Landed Volume | 38162 | tonnes | 2012 | | Landed Volume | 43734 | tonnes | 2013 | | Landed Volume | 41143 | tonnes | 2014 | | Landed Volume | 35316 | tonnes | 2015 |
Fishery Indicators | Type | Measure | Value | Unit | Time period |
|---|
| Production | Catch | 407970 | tonnes | 1972 | | Catch | 344861 | tonnes | 1973 | | Catch | 396836 | tonnes | 1974 | | Catch | 495078 | tonnes | 1975 | | Catch | 402360 | tonnes | 1976 | | Catch | 240394 | tonnes | 1977 | | Catch | 146733 | tonnes | 1978 | | Catch | 149190 | tonnes | 1979 | | Catch | 202674 | tonnes | 1980 | | Catch | 226530 | tonnes | 1981 | | Catch | 256136 | tonnes | 1982 | | Catch | 253237 | tonnes | 1983 | | Catch | 247297 | tonnes | 1984 | | Catch | 247317 | tonnes | 1985 | | Catch | 223843 | tonnes | 1986 | | Catch | 195106 | tonnes | 1987 | | Catch | 180062 | tonnes | 1988 | | Catch | 127703 | tonnes | 1989 | | Catch | 86743 | tonnes | 1990 | | Catch | 97204 | tonnes | 1991 | | Catch | 134969 | tonnes | 1992 | | Catch | 180145 | tonnes | 1993 | | Catch | 169385 | tonnes | 1994 | | Catch | 168815 | tonnes | 1995 | | Catch | 204822 | tonnes | 1996 | | Catch | 169954 | tonnes | 1997 | | Catch | 161971 | tonnes | 1998 | | Catch | 123405 | tonnes | 1999 | | Catch | 126824 | tonnes | 2000 | | Catch | 173353 | tonnes | 2001 | | Catch | 155174 | tonnes | 2002 | | Catch | 74406 | tonnes | 2003 | | Catch | 72470 | tonnes | 2004 | | Catch | 64085 | tonnes | 2005 | | Catch | 66962 | tonnes | 2006 | | Catch | 67371 | tonnes | 2007 | | Catch | 47759 | tonnes | 2008 | | Catch | 47968 | tonnes | 2009 | | Catch | 45442 | tonnes | 2010 | | Catch | 49661 | tonnes | 2011 | | Catch | 43195 | tonnes | 2012 | | Catch | 47092 | tonnes | 2013 | | Catch | 46295 | tonnes | 2014 | | Catch | 41571 | tonnes | 2015 |
Sources ICES Advice accessed through ICES Stock Assessment Database in 2018. ICES, Copenhagen.  http://standardgraphs.ices.dk/ViewCharts.aspx?key=8068 http://standardgraphs.ices.dk/ViewCharts.aspx?key=8068 |
|
| |
|