Greater argentine - Other areas of Northeast Atlantic|
| Fact Sheet Title Fact Sheet |
| | | Greater argentine - Other areas of Northeast Atlantic |
 | Greater Silver Smelt in Subdivisions I, II, IIIa, IV, Vb, VI, VII, VIII, IX, X, XII and XIV (other areas) |
| | Data Ownership | | This document provided, maintained and owned by International Council for the Exploration of the Sea (ICES) , is part of ICES Advice data collection. |
| | ident Block | ident Block | | | | Species List: | | Species Ref: en - Greater argentine, fr - Grande argentine |
|
|
| ident Block Greater argentine - Other areas of Northeast Atlantic
Map tips
- Click on
 to turn layers on and off to turn layers on and off
- Double-click to zoom in
- Drag to pan
- Hold down the shift key and drag to zoom to a particular region
| fao Div |
|---|
| 27.3.a | Skagerrak and Kattegat (Division 27.3.a) |
|---|
| 27.5.b | Faroes Grounds (Division 27.5.b) |
|---|
| fao Sub Area |
|---|
| 27.1 | Barents Sea (Subarea 27.1) |
|---|
| 27.2 | Norwegian Sea, Spitzbergen, and Bear Island (Subarea 27.2) |
|---|
| 27.4 | North Sea (Subarea 27.4) |
|---|
| 27.6 | Rockall, Northwest Coast of Scotland and North Ireland (Subarea 27.6) |
|---|
| 27.7 | Irish Sea, West of Ireland, Porcupine Bank, Eastern and Western English Channel, etc (Subarea 27.7) |
|---|
| 27.8 | Bay of Biscay (Subarea 27.8) |
|---|
| 27.9 | Portuguese Waters (Subarea 27.9) |
|---|
| 27.10 | Azores Grounds and Northeast Atlantic South (Subarea 27.10) |
|---|
| 27.12 | North of Azores (Subarea 27.12) |
|---|
| 27.14 | East Greenland (Subarea 27.14) |
|---|
|
|
|
|
| | Aq Res | Biological Stock: Yes
Value: Sub-Regional
Reference year: 2008 |
| Considered a management unit: An aquatic resource or fishery is
declared as [Fishery] Management Unit if it is
effectively the focus for the application of selected
management methods and measures, within the broader
framework of a management system. According to the FAO
Glossary for Responsible Fishing, "a Fishery Management
Unit (FMU) is a fishery or a portion of a fishery
identified in a Fishery Management Plan (FMP) relevant
to the FMP's management objectives." FMU's may be
organised around fisheries biological, geographic,
economic, technical, social or ecological dimensions ,
and the makeup and attribute of a fishery management
unit depends mainly on the FMP's management
objectives. |
| Jurisdictional distribution: Jurisdictional qualifier (e.g.
"shared", "shared - highly migratory") of the aquatic
resource related with its spatial distribution. |
| Environmental group: Classification of the aquatic
resource according to the environmental group (e.g.
pelagic invertebrate, or demersal fish) to which the
species belong. |
| Reference Year: The Reference Year is the last year considered in the stock assessment and/or fishery status. |
| | | | | | Aq Res State Trend The state of the silver smelt resource in other areas is unknown. Catches increased considerably in recent years, but were reduced in 2003 in some areas, partly due to introduction of TAC management in EU waters. In Subarea VI the frequency of old fish (20+) in the catches declined significantly after a few years of target fisheries. Such changes suggest high exploitation rates. Habitat Bio Depth Zone: Slope (200 m - 1000 m). Vertical Dist: Demersal/Benthic. Water Area Overview Spatial Scale: Sub-Regional Water Area Overview  | | Water Area Overview Greater argentine - Other areas of Northeast Atlantic
| fao Div | 27.3.a: Skagerrak and Kattegat (Division 27.3.a) | | 27.5.b: Faroes Grounds (Division 27.5.b) | | fao Sub Area | 27.1: Barents Sea (Subarea 27.1) | | 27.10: Azores Grounds and Northeast Atlantic South (Subarea 27.10) | | 27.12: North of Azores (Subarea 27.12) | | 27.14: East Greenland (Subarea 27.14) | | 27.2: Norwegian Sea, Spitzbergen, and Bear Island (Subarea 27.2) | | 27.4: North Sea (Subarea 27.4) | | 27.6: Rockall, Northwest Coast of Scotland and North Ireland (Subarea 27.6) | | 27.7: Irish Sea, West of Ireland, Porcupine Bank, Eastern and Western English Channel, etc (Subarea 27.7) | | 27.8: Bay of Biscay (Subarea 27.8) | | 27.9: Portuguese Waters (Subarea 27.9) |
| | | | | | Water Area Overview |
Water Area OverviewGreater argentine - Other areas of Northeast Atlantic | fao Major | 27:
Atlantic, Northeast | | Large Marine Ecosystem Areas (LME) | 19: East Greenland Shelf | | 20: Barents Sea | | 21: Norwegian Shelf | | 22: North Sea | | 24: Celtic-Biscay Shelf | | 25: Iberian Coastal | | 58: Kara Sea | | 59: East Greenland Shelf/Sea | | 60: Faroe Plateau | | 64: Arctic Ocean | | 65: Arctic Archipelago |
Aq Res Struct Biological Stock: Yes Exploit Factors affecting the fisheries and the stockRegulations and their effectsIn 2003 quota management was introduced in EU waters. In 2008 the EU TACs are: Subareas I and II 116 t Subareas III, and IV1331 t Subareas V, VI, and VII5311 t A licensing scheme has been in place for several years in Norway and the Faroes. The licensing system regulates the number of trawlers that can take part in the directed fishery. Norway introduced a TAC in Subarea II in 2007. Bio Assess Assess Models Methodology Scientific basisData and methodsLandings and mean length data are the basis for the advice. Total landings by area are presented in Tables 9.4.13.2.1 and 9.4.13.2.2. Comparison with previous assessment and adviceNo significant changes to the perception of the stock. Advice is the same as in 2006. Results Table 9.4.13.2.1. Greater silver smelt. Other areas (I, II, IIIa, IV, Vb, VI, VII, VIII, IX, X, XII, and XIV). Working group estimates of total landings (tonnes).
| Year |
I + II |
III + IV |
Vb |
VI + VII |
VIII |
XII |
XIV |
Total for other areas |
| 1988 |
11351 |
2718 |
287 |
10438 |
|
|
|
24794 |
| 1989 |
8390 |
3786 |
227 |
25559 |
|
|
|
37962 |
| 1990 |
9120 |
2321 |
2888 |
7294 |
|
|
6 |
21629 |
| 1991 |
7741 |
2554 |
60 |
5197 |
|
|
|
15552 |
| 1992 |
8234 |
5319 |
1443 |
5906 |
|
|
|
20902 |
| 1993 |
7913 |
3269 |
1063 |
1577 |
|
6 |
|
13828 |
| 1994 |
6807 |
1508 |
960 |
5707 |
|
|
|
14982 |
| 1995 |
6775 |
1082 |
12286 |
6242 |
|
|
|
26385 |
| 1996 |
6604 |
3300 |
9498 |
5863 |
|
1 |
|
25266 |
| 1997 |
4463 |
2598 |
8433 |
7300 |
|
|
|
22794 |
| 1998 |
8261 |
3982 |
17570 |
5555 |
|
|
|
35368 |
| 1999 |
7163 |
4320 |
8214 |
8856 |
|
2 |
|
28555 |
| 2000 |
6293 |
2471 |
5209 |
13866 |
|
|
217 |
28056 |
| 2001 |
14369 |
2925 |
10081 |
19050 |
|
|
66 |
46491 |
| 2002 |
7407 |
1811 |
7471 |
15985 |
191 |
|
|
32865 |
| 2003 |
8917 |
1188 |
6549 |
2451 |
37 |
|
|
19142 |
| 2004 |
16162 |
1157 |
6451 |
5133 |
23 |
4 |
|
28930 |
| 2005 |
17093 |
791 |
7009 |
3808 |
202 |
322 |
|
29225 |
| 2006 |
21685 |
4016 |
12559 |
1115 |
0 |
0 |
|
39375 |
| 2007* |
13273 |
3343 |
13357 |
223 |
0 |
0 |
|
30196 |
| * Preliminary. |
Table 9.4.13.2.2. Landings by country and area (tonnes). Greater silver smelt in I, II, IIIa, IV, Vb, VI, VII, VIII, IX, X, XII, and XIV. WG estimates of landings. *) preliminary.
| Greater silver smelt (Argentina silus) I and II |
| Year |
Germany |
Netherlands |
Norway |
Poland |
Russia/USSR |
Scotland |
France |
Faroes |
TOTAL |
| 1988 |
|
|
11332 |
5 |
14 |
|
|
|
11351 |
| 1989 |
|
|
8367 |
|
23 |
|
|
|
8390 |
| 1990 |
|
5 |
9115 |
|
|
|
|
|
9120 |
| 1991 |
|
|
7741 |
|
|
|
|
|
7741 |
| 1992 |
|
|
8234 |
|
|
|
|
|
8234 |
| 1993 |
|
|
7913 |
|
|
|
|
|
7913 |
| 1994 |
|
|
6217 |
|
|
590 |
|
|
6807 |
| 1995 |
357 |
|
6418 |
|
|
|
|
|
6775 |
| 1996 |
|
|
6604 |
|
|
|
|
|
6604 |
| 1997 |
|
|
4463 |
|
|
|
|
|
4463 |
| 1998 |
40 |
|
8221 |
|
|
|
|
|
8261 |
| 1999 |
|
|
7145 |
|
|
18 |
|
|
7163 |
| 2000 |
|
3 |
6075 |
|
195 |
18 |
2 |
|
6293 |
| 2001 |
|
|
14357 |
|
7 |
5 |
|
|
14369 |
| 2002 |
|
|
7405 |
|
|
2 |
|
|
7407 |
| 2003 |
|
555 |
8345 |
|
7 |
2 |
4 |
4 |
8917 |
| 2004 |
|
4601 |
11557 |
|
4 |
|
|
|
16162 |
| 2005 |
|
|
17063 |
|
16 |
|
|
14 |
17093 |
| 2006 |
|
|
21681 |
|
4 |
|
|
|
21685 |
| 2007* |
|
|
13272 |
|
1 |
|
|
|
13273 |
Greater silver smelt (Argentina silus) III and IV.
| Year |
Denmark |
Faroes |
France |
Germany |
Netherlands |
Norway |
Scotland |
Sweden |
Ireland |
TOTAL |
| 1988 |
1062 |
|
|
1 |
|
1655 |
|
|
|
2718 |
| 1989 |
1322 |
|
|
|
335 |
2128 |
1 |
|
|
3786 |
| 1990 |
737 |
|
|
13 |
|
1571 |
|
|
|
2321 |
| 1991 |
1421 |
|
1 |
|
3 |
1123 |
6 |
|
|
2554 |
| 1992 |
4449 |
|
|
1 |
70 |
698 |
101 |
|
|
5319 |
| 1993 |
2347 |
|
|
|
298 |
568 |
56 |
|
|
3269 |
| 1994 |
1480 |
|
|
|
|
4 |
24 |
|
|
1508 |
| 1995 |
1061 |
|
|
|
|
1 |
20 |
|
|
1082 |
| 1996 |
2695 |
370 |
|
|
|
213 |
22 |
|
|
3300 |
| 1997 |
1332 |
|
|
1 |
|
704 |
19 |
542 |
|
2598 |
| 1998 |
2716 |
|
|
128 |
277 |
434 |
|
427 |
|
3982 |
| 1999 |
3772 |
|
82 |
|
7 |
5 |
452 |
|
2 |
4320 |
| 2000 |
1806 |
|
270 |
|
|
32 |
78 |
273 |
12 |
2471 |
| 2001 |
1653 |
|
28 |
|
|
3 |
227 |
1011 |
3 |
2925 |
| 2002 |
1161 |
|
|
|
|
1 |
161 |
484 |
4 |
1811 |
| 2003 |
1119 |
|
|
|
42 |
6 |
20 |
|
1 |
1188 |
| 2004 |
1036 |
|
|
4 |
42 |
17 |
12 |
|
46 |
1157 |
| 2005 |
733 |
|
|
1 |
28 |
11 |
|
|
18 |
791 |
| 2006 |
548 |
|
|
|
|
3468 |
|
|
|
4016 |
| 2007* |
243 |
|
|
|
|
3100 |
|
|
|
3343 |
Table 9.4.13.2.2. Continued. Greater silver smelt (Argentina silus) Vb.
| Year |
Faroes |
Russia/USSR |
UK (Scot) |
UK(EWN) |
Ireland |
France |
Netherlands |
Norway |
TOTAL |
| 1988 |
287 |
|
|
|
|
|
|
|
287 |
| 1989 |
111 |
116 |
|
|
|
|
|
|
227 |
| 1990 |
2885 |
3 |
|
|
|
|
|
|
2888 |
| 1991 |
59 |
|
1 |
|
|
|
|
|
60 |
| 1992 |
1439 |
4 |
|
|
|
|
|
|
1443 |
| 1993 |
1063 |
|
|
|
|
|
|
|
1063 |
| 1994 |
960 |
|
|
|
|
|
|
|
960 |
| 1995 |
5534 |
6752 |
|
|
|
|
|
|
12286 |
| 1996 |
9495 |
|
3 |
|
|
|
|
|
9498 |
| 1997 |
8433 |
|
|
|
|
|
|
|
8433 |
| 1998 |
17570 |
|
|
|
|
|
|
|
17570 |
| 1999 |
8186 |
|
15 |
23 |
|
5 |
|
|
8214 |
| 2000 |
3713 |
1185 |
247 |
|
|
64 |
|
|
5209 |
| 2001 |
9572 |
414 |
94 |
|
1 |
|
|
|
10081 |
| 2002 |
7058 |
264 |
144 |
|
|
|
5 |
|
7471 |
| 2003 |
6261 |
245 |
1 |
|
|
|
42 |
|
6549 |
| 2004 |
3441 |
702 |
42 |
|
|
|
2266 |
|
6451 |
| 2005 |
6939 |
59 |
|
|
|
|
11 |
|
7009 |
| 2006 |
12524 |
35 |
|
|
|
|
|
|
12559 |
| 2007* |
13354 |
3 |
|
|
|
|
|
32 |
13357 |
Greater silver smelt (Argentina silus) VI and VII.
| Year |
Faroes |
France |
Germany |
Ireland |
Netherl |
Norway |
E & W |
Scotland |
N.I. |
Russia |
Spain |
TOTAL |
| 1988 |
|
|
|
5454 |
|
4984 |
|
|
|
|
|
10438 |
| 1989 |
188 |
|
|
6103 |
3715 |
12184 |
198 |
3171 |
|
|
|
25559 |
| 1990 |
689 |
|
37 |
585 |
5871 |
|
|
112 |
|
|
|
7294 |
| 1991 |
|
7 |
|
453 |
4723 |
|
|
10 |
4 |
|
|
5197 |
| 1992 |
|
1 |
|
320 |
5118 |
|
|
467 |
|
|
|
5906 |
| 1993 |
|
|
|
|
1168 |
|
|
409 |
|
|
|
1577 |
| 1994 |
|
|
43 |
150 |
4137 |
|
|
1377 |
|
|
|
5707 |
| 1995 |
1597 |
|
357 |
6 |
4136 |
|
|
146 |
|
|
|
6242 |
| 1996 |
|
|
1394 |
295 |
3953 |
|
|
221 |
|
|
|
5863 |
| 1997 |
|
|
1496 |
1089 |
4695 |
|
|
20 |
|
|
|
7300 |
| 1998 |
|
|
463 |
405 |
4687 |
|
|
|
|
|
|
5555 |
| 1999 |
|
21 |
24 |
394 |
8025 |
|
|
387 |
|
5 |
|
8856 |
| 2000 |
|
17 |
482 |
4703 |
3636 |
|
|
4965 |
|
29 |
34 |
13866 |
| 2001 |
|
12 |
189 |
7494 |
3659 |
|
|
7620 |
|
76 |
|
19050 |
| 2002 |
|
|
150 |
7589 |
4020 |
|
|
4197 |
|
29 |
|
15985 |
| 2003 |
|
|
164 |
95 |
1933 |
|
|
89 |
|
163 |
7 |
2451 |
| 2004 |
|
147 |
652 |
46 |
3731 |
|
|
526 |
|
12 |
19 |
5133 |
| 2005 |
103 |
10 |
131 |
1 |
3465 |
|
|
75 |
|
4 |
19 |
3808 |
| 2006 |
53 |
|
|
|
1062 |
|
|
|
|
|
|
1115 |
| 2007* |
220 |
|
|
|
|
3 |
|
|
|
|
|
223 |
Table 9.4.13.2.2. Cont’d. Greater silver smelt (Argentina silus) VIII.
| Year |
Netherlands |
TOTAL |
| 2002 |
191 |
191 |
| 2003 |
37 |
37 |
| 2004 |
23 |
23 |
| 2005 |
202 |
202 |
| 2006 |
|
|
| 2007* |
|
|
| SPA WG data zero in all years 97-2001 |
| Greater silver smelt (Argentina silus) XII. |
| Year |
Faroes |
Iceland |
Russia |
Netherlands |
TOTAL |
| 1988 |
|
|
|
|
|
| 1989 |
|
|
|
|
|
| 1990 |
|
|
|
|
|
| 1991 |
|
|
|
|
|
| 1992 |
|
|
|
|
|
| 1993 |
6 |
|
|
|
6 |
| 1994 |
|
|
|
|
|
| 1995 |
|
|
|
|
|
| 1996 |
1 |
|
|
|
1 |
| 1997 |
|
|
|
|
|
| 1998 |
|
|
|
|
|
| 1999 |
|
|
|
|
|
| 2000 |
|
2 |
|
|
2 |
| 2001 |
|
|
|
|
|
| 2002 |
|
|
|
|
|
| 2003 |
|
|
|
|
|
| 2004 |
|
|
4 |
|
4 |
| 2005 |
|
|
|
322 |
322 |
| 2006 |
|
|
|
|
|
| 2007* |
|
|
|
|
|
| Greater silver smelt (Argentina silus) XIV. |
| Year |
Norway |
Iceland |
TOTAL |
|
| 1988 |
|
|
|
|
| 1989 |
|
|
|
|
| 1990 |
6 |
|
6 |
|
| 1991 |
|
|
|
|
| 1992 |
|
|
|
|
| 1993 |
|
|
|
|
| 1994 |
|
|
|
|
| 1995 |
|
|
|
|
| 1996 |
|
|
|
|
| 1997 |
|
|
|
|
| 1998 |
|
|
|
|
| 1999 |
|
|
|
|
| 2000 |
|
217 |
217 |
|
| 2001 |
66 |
|
66 |
|
| 2002 |
|
|
|
|
| 2003 |
|
|
|
|
| 2004 |
|
|
|
|
| 2005 |
|
|
|
|
| 2007* |
|
|
|
|
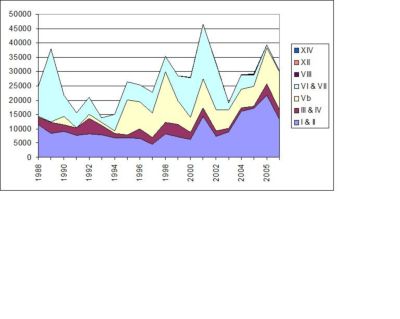 | Figure 9.4.13.2.1. Greater silver smelt. Other areas (I, II, IIIa, IV, Vb, VI, VII, VIII, IX, X, XII, and XIV). Working group estimates of total landings (tonnes).  |
Sci Advice Single-stock exploitation boundariesDue to its low productivity greater silver smelt can only sustain low rates of exploitation. Fisheries on such species should always be accompanied by programmes to collect data on both target and bycatch fisheries. The fishery should not be allowed to expand unless it can be shown that it is sustainable. Management Advice Management considerationsGreater silver smelt can be a very significant discard of the trawl fisheries of the continental slope of Subareas VI and VII, particularly at depths of 300–700 m. The existing knowledge base is insufficient to determine whether the current exploitation is sustainable. The variability in the catches appears to reflect market demand. In 2002, ICES expressed concern about the apparent increase in the directed fishery in several Subareas and especially the increased landings in Subarea VI. It was noted that the age range had been truncated, which suggested high levels of exploitation. Mean length and age in the landings in Division Vb have decreased since 1995. No new data could be used to determine whether these trends have continued. Sources ICES.2009.Report of the ICES Advisory Committee, 2009. ICES Advice, 2009. |
|
| |
|
|


