Marine resources - Northwest Atlantic|
| Fact Sheet Title Fact Sheet |
| | | Marine resources - Northwest Atlantic |
 | All resources in FAO Statistical Area 21 |
| | Data Ownership | | This document owned by Food and Agriculture Organization (FAO), provided and maintained by Marine and Inland Fisheries Branch (FIRF) , is part of FAO Global Marine Fishery Resource Reports data collection. |
| | ident Block | ident Block | | | | Species List: All aquatic species | |
|
| ident Block Marine resources - Northwest Atlantic Map tips - Click on
 to turn layers on and off to turn layers on and off - Double-click to zoom in
- Drag to pan
- Hold down the shift key and drag to zoom to a particular region
| fao Major |
|---|
| 21 | Atlantic, Northwest |
|---|
|
|
|
|
| | Aq Res | Biological Stock: No Value: Regional
Management unit: No Reference year: 2009
|
| Considered a management unit: An aquatic resource or fishery is declared as [Fishery] Management Unit if it is effectively the focus for the application of selected management methods and measures, within the broader framework of a management system. According to the FAO Glossary for Responsible Fishing, "a Fishery Management Unit (FMU) is a fishery or a portion of a fishery identified in a Fishery Management Plan (FMP) relevant to the FMP's management objectives." FMU's may be organised around fisheries biological, geographic, economic, technical, social or ecological dimensions , and the makeup and attribute of a fishery management unit depends mainly on the FMP's management objectives. |
| Jurisdictional distribution: Jurisdictional qualifier (e.g. "shared", "shared - highly migratory") of the aquatic resource related with its spatial distribution. |
| Environmental group: Classification of the aquatic resource according to the environmental group (e.g. pelagic invertebrate, or demersal fish) to which the species belong. |
| Reference Year: The Reference Year is the last year considered in the stock assessment and/or fishery status. |
| | | | | | Aq Res State Trend To access all FIRMS State and Trend summaries available for this Area, please look at: Status and Trend Summaries (extracted from reports)RESOURCES UNDER NAFO COMPETENCE AREA To access all FIRMS marine resource reports available for NAFO, please look at: NAFO marine resources fact sheets GREENLANDThe main commercial fish species are Greenland halibut, Atlantic cod, lumpfish, Greenland cod, redfish and wolffish (Anarhichidae). Annual landings of these species have shown major changes in the past century. The current status of exploitation and trend in catch in the region are shown in Table D1. Annual catches of cod averaged 6 677 tonnes between 1999 and 2008 and were well below the catches of the 1960s and 1970s. Landings of lumpfish have only constituted a significant portion of the landings in recent years and wolffish (striped) has been increasing since 2000. Cod, Greenland waters Historically, cod was the most important commercial fish species in Greenland waters, with annual catches peaking between 400 000 and 500 000 tonnes in the 1960s. Low recruitment and overfishing have played an important role in the collapse of the cod fishery since the 1960s. This stock has shown some recovery and catches increased from 1 700 tonnes in 2001 to 20 000 tonnes in 2008. The presence and abundance of cod in offshore waters off Greenland is believed to be related to environmental conditions and the periodic influx of larvae from Iceland that subsequently migrate back to spawn (Buch, Hirsted and Hovgård, 1994). Shrimp, Greenland waters Shrimp are the principal invertebrate resource in this region in terms of landings. Fisheries for snow crab and Icelandic scallops are small compared with shrimp. Shrimp biomass increased in the 1970s to 1990s, and it currently supports by far the largest fishery off Greenland. It has undergone a continuous increase from 1 791 tonnes in 1960 to 145 233 tonnes in 2008 (71 percent of the total landings), surpassing cod landings in 1984. Given the importance of this fishery, the West Greenland Shrimp Fishery Plan was developed as a result of the new purposes section of the Greenland Fishery Act introduced in 2010. This plan states: “In the administration of this Act, emphasis must be placed on the conservation and reproduction of resources and on keeping the fishery’s impact on the ecosystem at an acceptable level”. Greenland halibut, Greenland waters Greenland halibut currently represents the second largest fishery, although it made up only 10 percent of total landings in 2008. Historically, Greenland halibut were only a minor portion of the landings. However, catches increased from 1 159 tonnes in 1971 to 20 064 tonnes in 2008. From 2000 to 2008, Greenland halibut was the principal groundfish caught and averaged 29 605 tonnes. Canadian fisheries now exist in Area 21 for about 35 fish and invertebrate species. They comprise a multitude of stocks and management units that are all managed under the Fisheries Act. Some of the recently developed fisheries, primarily in the 1990s and thereafter, exploit underutilized species. These fisheries have been developed in an attempt to replace fisheries for the depleted demersal fish stocks. They include skate, spiny dogfish, white hake, wolffish, sea urchins, whelks, periwinkles, offshore bivalves, krill and marine worms. These new target fisheries have been successful to varying degrees but most remain a minor component of the overall production. The lack of recovery, or limited recovery, for some historical fisheries such as cod, witch flounder and redfish was concluded to be the result of several factors working simultaneously or in turn. These factors appeared to have affected fish growth, reproduction and fish survival. Prompt recovery in any of these stocks has not occurred. Conversely, invertebrates remain at near record levels of abundance. Descriptions of stock status are derived mainly from stock status reports located on the Web site of Fisheries and Oceans Canada at www.isdm-gdsi.gc.ca/csas-sccs/applications/publications/index-eng.asp and www2.mar.dfo-mpo.gc.ca/science/trac/ tsr.html. Materials pertaining to quotas and management can be found at www.dfo-mpo.gc.ca/fm-gp/index-eng.htm. Cod, Canadian waters Catches of northern Gulf of St. Lawrence cod stock (Div. 3Pn4RS) exceeded 100 000 tonnes in 1983 and constituted overfishing. The abundance of fish aged more than three years declined from 1980 to 1994. The fishery was closed in 2003 but was reopened the following year as the SSB increased to 76 million in 2009 owing to a strong 2006 year class. The stock now supports a limited fishery with a total allowable catch (TAC) of 7 000 tonnes in 2008. Natural mortality remains high, with seal predation attributed as the major cause (Fisheries Resource Conservation Council, 2003a, 2003b, 50 000 tonnes annually as recently as the early 1990s when the stock collapsed and has remained low since. The 2005–08 SSBs were the lowest observed since 1971. Natural mortality is high (~ 0.6), so recovery in the near term is very unlikely. The present TAC of 2 000 tonnes and a catch of 1 500 tonnes are considered too high to allow recovery. The cod stocks off southern Newfoundland (Subdiv. 3Ps) sustained catches that varied about 60 000 tonnes prior to the mid-1970s, but that resulted in decline of the stock. The fishery was closed from 1994–96 but reopened in 1997. The abundance has fluctuated without an obvious trend since the 1980s. The SSB declined between 2004 and 2008, increased in 2009 and is now near the 1998–2009 average. Low recruitment continues to be an issue. The TAC now stands at 11 500 tonnes, which is down from 20 000 tonnes in 2000. This stock now supports the largest cod fishery off Canada. To the south, cod stocks on the northeast Scotian Shelf (Div. 4VsW and Div. 4Vn) have been under a moratorium since 1993. They continue to be at or near the lowest spawning biomass ever recorded, with recruitment, growth and condition all below average. For the southwest Scotian Shelf and Bay of Fundy (Div. 4X5Y) cod stock, recruitment has improved. This started with the 1998 year class and although biomass has increased since the late 1990s, it remains low. Haddock, Canadian waters Prior to the late 1960s, haddock was the second-most important demersal fish resource after cod and was the first stock to collapse. Div. 3NO haddock (southern Grand Bank) catches peaked at 76 000 tonnes in 1961 but declined rapidly to a remnant population and have been under moratorium since 2001. The Div. 4TVW stock (Gulf of St. Lawrence/Scotian Shelf) has also been under moratorium since 1989. It shows little or no sign of improvement. The Div. 4X5Y stock (southern Scotian Shelf/Bay of Fundy) has been stable since the 1990s and its SSB has increased in the past decade. The present TAC is 7 000 tonnes. Canada fishes part of the eastern Georges Banks stock, which had an increasing TAC of 29 600 tonnes in 2010. Its SSB has more than doubled since the mid-2000s. The 2003 year class is exceptional and the largest on record. This stock is now the largest haddock population in Area 21. Redfish, Canadian waters Redfish was one of the early targets of the new Canadian wet-fish trawler fleet. Canadian catches peaked briefly at close to 160 000 tonnes in 1973, but are currently averaging about 20 000 tonnes. The stock in Div. 2+3K (Labrador Shelf) was once one of the largest. It now remains under moratorium and shows no sign of recovery. The stock in Div. 3LNO (Grand Bank) was closed in 1998. It was reopened in 2009 with a small TAC of 3 500 tonnes. Div. 3O redfish (southern Grand Bank) has been more stable in the long term and the current TAC is 20 000 tonnes. Unit 1 and Unit 2 (Gulf of St. Lawrence/Scotian Shelf) are now considered to be a single stock that has a TAC of 10 300 tonnes. This stock is rebuilding at present. One of the complicating factors in managing redfish fisheries is that they comprise a mix of three closely related species Sebastes marinus, S. mentella and S. fasciatus. The most recent assessments treat the species separately although catch statistics remain problematic. Pollock, Canadian waters Pollock supports limited fisheries on the Scotian Shelf. Catches have increased in recent years to about 15 000 tonnes, which is half the average between 1960 and 1970. Witch flounder biomass and commercial catch have remained low (average 1 800 tonnes annually) since the decline of the various stocks in the early 1990s. Of the five stocks, three are under moratorium and one is only taken as bycatch. Yellowtail flounder on the Grand Banks (Div. 3LNO) stands out as it has undergone a full recovery to near virgin biomass. Other small fisheries for demersal fish species include white hake, cusk (currently under moratorium), winter flounder, silver hake, Atlantic halibut (recent assessments of this valuable species indicate that partial recovery has taken place), thorny skate and spiny dogfish. At about the time that demersal fish stocks were declining or collapsing, the biomass of two invertebrate species, shrimp (primarily P. borealis) and snow crab, were increasing. The increase in biomass was widespread and fisheries for these two species were expanding.
Other invertebrates fished off Canada include surf clam, soft clam, rock and Jonah crab, oyster, sea urchin, Icelandic scallop, hard clam, periwinkle and whelk. These are all relatively minor fisheries compared with the industrial fisheries described above. Snow crab, Canadian waters Snow crab started to undergo a large increase in biomass throughout its range in the 1970s. Catch had been almost non-existent in the 1960s but increased rapidly to peak in the 1980s before declining. Between 1990 and 2002, landings quadrupled from just over 26 000 tonnes to almost 107 000 tonnes. Snow crab catches were 83 584 tonnes in 2010 with a TAC of 87 952 tonnes. The management of the snow crab fisheries was developed in the 1980s and 1990s. It is based on annual TACs, quotas, effort controls, minimum legal size, minimum mesh size of traps, seasons, areas, and soft-shelled (also known as white crab) protocols. Although market issues affected prices in the mid-2000s, crab is the most lucrative east coast fishery and even surpasses lobster. Lobster, Canadian waters Lobster has been a mainstay of inshore fisheries in Atlantic Canada since the late 1800s. The fishery started to increase its catches in the 1980s and these reached near-record levels in the 1990s after being depleted for half a century. Ecological changes may have led to the increased lobster production, although there is no agreement on the specific cause. Increased fishing efficiency has also played a role in increasing catch rates. Lobster catches reached a peak of 48 500 tonnes in 1991, declined through the following decade and are now at record high catches in excess of 50 000 tonnes. However, the Fisheries Resource Conservation Council warned in 2007 that, although the stocks are in good shape at present, they are overexploited with insufficient larger females to spawn and release their eggs to ensure long-term sustainability. Larger ships and more efficient technology are thought to present increased risks to Atlantic Canada’s lucrative lobster industry. Herring, Canadian waters The fishery for herring is the largest small pelagic fishery and one of the largest fisheries in eastern Canada with a catch of 166 000 tonnes and an export value of more than US$110 million in 2008. Historically, it ranks second after cod in terms of long-term catch. Several gear types are used, primarily gillnet, purse seine and weir. Capelin, Canadian waters Capelin fisheries occur on the Labrador Shelf and Grand Banks and have fluctuated in the long term. Catches rose rapidly in the 1970s and 1980s peaking in 1988–1990. The species was taken in large amounts by non-Canadian fleets and overfishing resulted in the collapse of various stocks. Some recovery in the fishery has been observed in recent years. Atlantic mackerel, Canadian waters Atlantic mackerel is a highly migratory species that arrives in May and occurs as far north as northeast Newfoundland. Catches are unpredictable in many areas, depending on the migration patterns that may change depending on water conditions. The largest catches of Atlantic mackerel were recorded between 2003 and 2007. The overall TAC was 80 000 tonnes for 2010, in spite of the apparent drop in biomass and uncertainty around stock status. The main gear types used in the mackerel fishery including traps, gillnets, handlines, bar seines and purse seines. For more information on the mackerel fishery, refer to Fisheries and Oceans Canada (2010). Other small pelagic species fished off Canada include alewife (Alosa pseudoharengus) and American shad but these constitute minor inshore fisheries. The largest fisheries in the northeast of the United States of America catch mainly pelagic and invertebrate species in the following order: menhaden, surf clam, ocean quahog, sea scallop, oyster, herring, blue crab, hard clam and lobster. The oyster fishery has the longest history, taken in intertidal areas by aboriginal peoples and later in the seventeenth century by early European settlers. It now lands a fraction of the amount observed in the 1970s owing to a collapse in the 1980s. The menhaden fishery was developed in the 1950s and 1960s and has sustained the largest fishery off the eastern United States of America. Scallop, quahog and lobster are at or near peak production. Except for a period of intense distant-water fleet fishing from the 1960s and 1970s, the demersal fish fishery in United States waters has been domestic. Demersal species, United State Northeast coast Demersal species have been the traditional mainstay of the fisheries off the United States northeast coast. Redfish, haddock, silver hake and yellowtail flounder were the dominant demersal fish fisheries in the 1960s with catches reaching 40 000 tonnes to 60 000 tonnes for each of those species. The abundance of demersal fish species declined by 70 percent between 1963 and 1974 as a consequence of overfishing by distant-water fleets. Some recovery occurred in the late 1970s following catch and effort reductions implemented by the International Commission for the Northwest Atlantic Fisheries prior to 1977 and the establishment of the United States EEZ in 1977. However, the recovery was short-lived owing to increased fishing pressure by the United States fleet. Overall abundance of commercially important demersal fish species reached a record low in 1992.
Since the mid-1990s, fishing mortality rates have been reduced and rebuilding begun for stocks such as haddock, yellowtail flounder and summer flounder (Paralichthys dentatus). This improvement in the status of these species was a result of stringent management measures (including a moratorium on new vessel entrants, drastic reductions in days at sea for trawl and gillnet vessels, increased mesh sizes, several large year-round closed areas). Atlantic menhaden, Atlantic waters of United States of America Atlantic menhaden (Brevoortia tyrannus) is taken mainly by purse seiners off the mid-Atlantic states of the United States of America. This is the largest fishery resource in the Atlantic waters of the United States of America and the dominant pelagic species. The catch in 2008 was 189 000 tonnes, which was down from a peak of more than 400 000 tonnes in 1990–91. The catch history shows fluctuations without any major trends and it is considered not to be overfished. This is largely a reduction fishery, but the species also plays an important role in the ecosystem as forage for many species and as a major consumer of plankton. Herring and mackerel, Atlantic waters of united States of America Herring and mackerel were heavily exploited by distant-water fleets in the late 1960s and early 1970s. Abundance declined in the mid-1970s and early 1980s before subsequently rebuilding in the absence of intensive fishing. Since 1983, the index has markedly increased, with the 1994 value the highest in the time series. The Georges Bank herring stock biomass increased from about 111 600 tonnes in 1982 to 830 000 tonnes in 1997 and was estimated to be 652 000 tonnes in 2008 (more information available on the Web site of the NOAA at www.nefsc.noaa.gov/sos/agtt/). Combined herring landings for Canada and the United States of America increased from 106 000 tonnes in 2005 to 116 000 tonnes in 2006, then declined to 90 000 tonnes in 2008. United States catches comprised 26.1 percent of total herring harvest, the remainder being taken by Canada. Mackerel catches increased in the early-to-mid-2000s but declined in 2007 and 2008. Catches in 2002 were 70 456 tonnes (61.2 percent Canada, 38.8 percent the United States of America) and, although at the high end for the decade, they remain still far below the long-term estimated potential of 383 000 tonnes. The combined mackerel catch for Canada and the United States of America was 50 685 tonnes in 2008. Anadromous species, Atlantic waters of United States of America This is a diverse group including river shads such as alewife and blueback (Alosa aestivalis), American shad (Alosa sapidissima), striped bass (Morone saxatilis), Atlantic salmon (Salmo salar), Atlantic sturgeon (Acipenser oxyrinchus oxyrinchus) and shortnosed sturgeon (Acipenser brevirostrum). The composite average yield from 2000 to 2002 was only about 3 978 tonnes. This was far below the historic maximum of 32 443 tonnes in 1959. All of these species, except striped bass, are overexploited and their abundance is low. The combined commercial and recreational catches of striped bass reached a record low of 423 tonnes in 1989 and highly restrictive regulatory measures were imposed in the mid-1980s. Stock rebuilding followed good recruitment and the stock was declared restored in 1995. The catch of striped bass was 5 020 tonnes in 2008.
The last two decades have marked a period of decline in stock status for all Atlantic salmon populations of the North Atlantic. Population estimates indicate that survival plummeted as much as fivefold for some stocks. This decline in survival has intensified concern over the additive effects of natural mortality in the marine environment and habitat issues that persist in United States rivers. The US Atlantic Salmon Assessment Committee report indicated one of the lowest long-term returns in 1999 when only 1 452 adults returned to United States rivers (NOAA, 2011). Offshore fisheries for invertebrate species including lobsters, surf clams (Spisula solidissima), ocean quahogs (Arctica islandica), longfin squid (Loligo pealeii), shortfin squid (Illex illecebrosus), sea scallops, northern shrimp and red crab (Chaceon quinquedens) are among the most valuable in the northeast of the United States of America. Fisheries for invertebrate species in nearshore and estuarine waters include blue crabs (Callinectes sapidus), oysters (Crassostrea virginica), hard clams (Mercenaria mercenaria), sea urchins (Strongylocentrotus spp.), and softshell clams (Mya arenaria). Sea worms (including primarily sandworm [Nereis virens], and bloodworm [Glycera dibranchiata]), whelks (Busycotypus canaliculatus, Busycon carica and B. sinistrum), and blue mussels (Mytilus edulis) are commonly harvested for use as bait in recreational fisheries.
United States catches of the valuable lobster fishery increased after 1940 and peaked at 39 832 tonnes in 2008. The recent increases have resulted from both increased effort as well as apparent increases in abundance, probably owing to favourable environmental conditions. However, fishing mortality is two to three times in excess of overfishing reference limits, and catches are dependent on newly moulted and sexually immature animals. Recent regulatory measures (limits on the number of traps per fisher) may not be sufficiently stringent to achieve the required reduction in fishing mortality. Surf clams and ocean quahogs, Atlantic waters of United States of America Surf clams and ocean quahogs, regulated by an individual transferable quota (ITQ) system implemented in 1990, are harvested by dredges primarily in the Mid-Atlantic and Southern New England region. These species are currently underexploited. Catches of both species have remained relatively stable in recent years with 1999–2008 averages of 151 430 tonnes and 135 475 tonnes, respectively. Longfin and shortfin squid, Atlantic waters of United States of America Fisheries for longfin and shortfin squid have existed since the 1800s. In the early years, they were primarily used for bait. The fishery generated catches of about 1 000 tonnes or less per year for each species until the 1970s. The fishery expanded greatly in the 1980s and 1990s in response to growing markets for human consumption. Longfin squid are fished primarily between North Carolina and the Gulf of Maine, while shortfin squid have been fished from North Carolina to Newfoundland and are assumed to constitute a unit stock. Distant-water fisheries for these two species existed between 1964 and 1986, with catches from United States waters peaking for longfin squid at 36 500 tonnes in 1973 and for shortfin squid at 24 700 tonnes in 1976. The average yields of squid for 1999–2008 were 15 095 tonnes for longfin and 10 486 tonnes for shortfin. Habitat Bio Climatic Zone: Polar; Temperate. The marine environment of the region encompasses the extremes, from Arctic to subtropical conditions. It includes three large oceanographic regions identified by the International Council for the Exploration of the Sea (ICES, 2011). The first is the Eastern Arctic (EA), which comprises Baffin Bay and allows Arctic waters to flow south (Dickson et al., 2007). The second region is the Sub-Polar Northwest Atlantic (SP-NWA), which extends from Davis Strait south to the Tail of the Grand Bank. This region is strongly influenced by a subpolar gyre (Loder, Petrie and Gawarkiewicz, 1998) and the cold Labrador Current (Colbourne et al., 2010), which carries subpolar water south along the shelf to mid-latitudes in the upper ocean. The third region is the Mid-Latitude “Transition Zone” (MLTZ) from Cape Hatteras north to the largely enclosed Gulf of St Lawrence, eastward to the Tail of the Grand Bank. This region is affected by competing influences of the counter-flowing subpolar, subtropical and slope waters (Loder, Petrie and Gawarkiewicz, 1998). Warm tropical Gulf Stream waters come into close proximity to subpolar (Labrador Current) waters at the southern edge of the Grand Banks. Here, subsurface temperatures change from subzero to over 20 °C within a few kilometres (red to purple transition in Figure B1.2). Subpolar waters have generally dominated much of the shelf in this zone in recent history (Wanamaker et al., 2007), but there are increasing influences of subtropical waters towards Cape Hatteras. 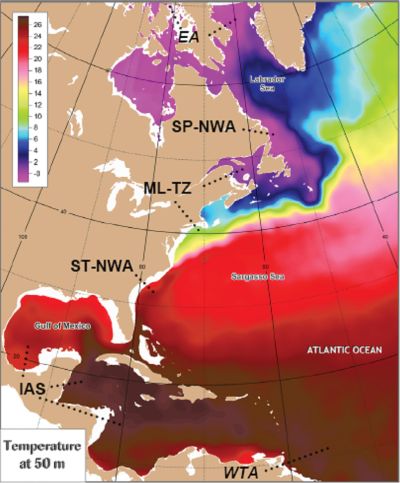 | Figure B1.2 Long-term annual-mean temperature Notes: Major oceanographic region: EA = Eastern Arctic; SP-NWA = Sub-Polar NW Atlantic; ML-TZ = Mid-Latitude Transition Zone; ST-WNA = Sub-Tropical Western North Atlantic. IAS = Intra-Americas Sea; WTA = Western Tropical Atlantic. From Yashayaev (1999)  |
Water Area Overview Area 21 extends over 6.5 million km2 and covers 43 degrees of latitude from Greenland to the Carolinas off the United States of America (Figure B1.1). It encompasses an extensive continental shelf and slope out to 1 000 m that covers 1.3 million km2. It comprises the mid-Atlantic Bight of the United States of America, Georges Bank/Gulf of Maine, the Scotian Shelf, the Gulf of St Lawrence, the Grand Banks, the northeast Newfoundland and Labrador Shelves, Davis Strait and Baffin Bay bordering the Arctic Basin. It is one of the few places in the world where the continental shelf extends into international waters beyond 200 nautical miles from land – this occurs on both the Grand Banks and the Flemish Cap. As a result, some of the fisheries are managed by an RFMO, namely, the Northwest Atlantic Fisheries Organization (NAFO). 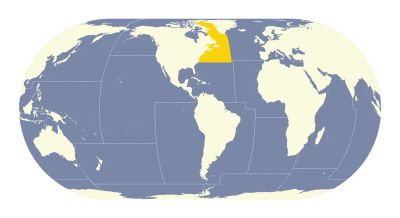 | | Figure B1.1 The Northwest Atlantic (Area 21) |
Water Area Overview  | | Water Area Overview Marine resources - Northwest Atlantic
| fao Major | 21: Atlantic, Northwest |
| | | | | | Water Area Overview |
Water Area OverviewMarine resources - Northwest Atlantic | fao Major | 21: Atlantic, Northwest | | Large Marine Ecosystem Areas (LME) | 6: Southeast U.S. Continental Shelf | | 7: Northeast U.S. Continental Sh | | 8: Scotian Shelf | | 9: Newfoundland-Labrador Shelf | | 18: West Greenland Shelf | | 59: East Greenland Shelf/Sea | | 63: Hudson Bay | | 65: Arctic Archipelago | | 66: Baffin Bay/Davis Straight |
Aq Res Struct Biological Stock: No Exploit Profile of catches Nominal catches in Area 21 doubled from 2.3 million tonnes in 1950 to peak at 4.6 million tonnes in 1968 (Figure B1.3; Table D1). Catches subsequently declined from 4.4 million tonnes in 1973 to 2.8 million tonnes in 1978. They stabilized at about 2.7 million tonnes until 1984 then increased slowly, reaching 3.3 million tonnes in 1990. Catches subsequently declined steeply to about 2 million tonnes in 1994, as a result of the groundfish collapse off eastern Canada. A slight recovery has been evident since 1998, when 1.96 million tonnes were reported. Total catch increased to 2.3 million tonnes in 2001 and has fluctuated around that value since then. 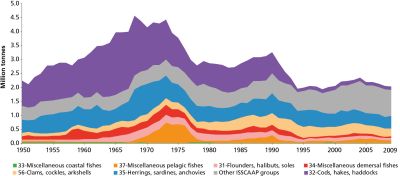 | | Figure B1.3 Annual nominal catches by ISSCAAP species groups in the Northwest Atlantic (Area 21) |
Historic patterns in catch in Area 21 are primarily affected by changes in cod (decrease) and shrimp (increase) stocks. Cod catches dominated the fisheries catches prior to the 950s and increased in the 1960s to a peak of almost 2 million tonnes. They then declined to below 500 000 tonnes in 1977 as a result of overfishing and other factors noted above. The catches from the southern Labrador – eastern Newfoundland stock (northern cod) contributed significantly to the overall cod catches in the period 1953–1987 and accounted on average for almost 40 percent of the total. Catches of cod then declined precipitously in the early 1990s, dropping to 40 000 tonnes by 2003 – 2005. They then increased to 60 000 tonnes by 2008. In contrast, shrimp, previously fished in small amounts, less than 10 000 tonnes prior to the 1980s now constitutes the largest nominal catch of any species in Area 21 (287 000 tonnes in 2009). Catches of Atlantic herring, redfish, silver hake (Merluccius bilinearis), haddock, Atlantic menhaden and sea scallop also increased in the 1950s and 1960s (Figure B1.4). These were followed by increased catches of Atlantic mackerel (Scomber scombrus) and capelin (Mallotus villosus) (Figure B1.5) as a result of increasing distant-water fleet effort. Flatfish catches peaked at 303 000 tonnes in 1968 (Figure B1.6), then declined to 78 600 tonnes by 1995. By 2002, catches of flatfish had recovered to 116 400 tonnes. However, the catch composition had changed with just over half being made of Greenland halibut (Reinhartius hippoglossoides). Fisheries for invertebrates have fared better (Figure B1.7), showing increases from the mid-1970s to the early 1990s, when more than 600 000 tonnes were caught. 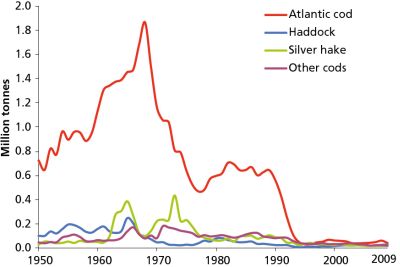 | | Figure B1.4 Annual nominal catches of selected species in ISSCAAP Group 32, Northwest Atlantic (Area 21) |
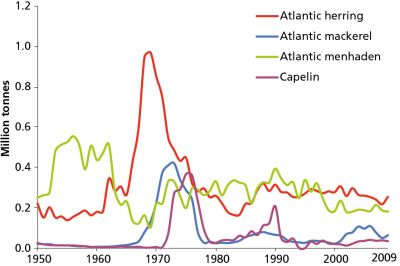 | | Figure B1.5 Annual nominal catches of selected species in ISSCAAP Group 35, 37, Northwest Atlantic (Area 21) |
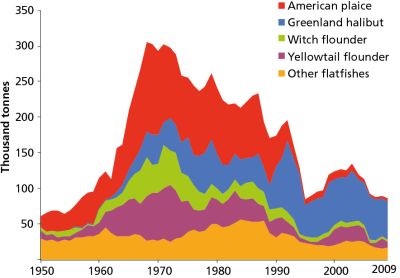 | | Figure B1.6 Annual nominal catches of selected species in ISSCAAP Group 31, Northwest Atlantic (Area 21) |
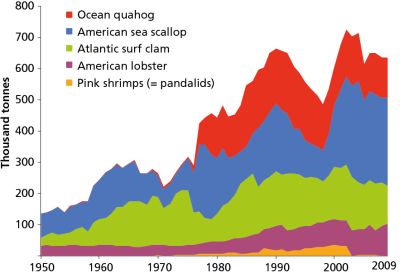 | | Figure B1.7 Annual nominal catches of selected species in ISSCAAP Groups 43, 45, 55, 56, Northwest Atlantic (Area 21) |
Catches of shellfish, primarily sea scallops (Placopecten magellanicus), ocean quahog (Arctica islandica) and surf clams (Mactromeris polynyma) decreased during most of the 1990s, but have increased in recent years. In the 1960s, the major species fished in order were: cod, Atlantic herring, Atlantic redfishes, silver hake, haddock, Atlantic menhaden, sea scallop, surf clam and American oyster (Crassostrea virginica). These species accounted for 80 percent of the total reported landings. In the period from 2001 to 2009, catches were dominated by invertebrate and pelagic fish species. The largest catches have been made of shrimps (average 311 297 tonnes), sea scallop (average 285 402 tonnes), Atlantic herring (average 261 932 tonnes), Atlantic menhaden (average 194 101 tonnes), Atlantic surf clam (average 151 783 tonnes), snow crab (average 102 424 tonnes), American lobster (average 86 942 tonnes), Atlantic mackerel (average 77 285 tonnes), Greenland halibut (average 60 156 tonnes), cod (average 48 416 tonnes), blue crab (Callinectes sapidus, average 39 664 tonnes)and Atlantic redfish NEI (average 38 903 tonnes). Those 13 species made up 80 percent of the reported catch in that period. Management Management unit: No FISHERIES UNDER NAFO JURISDICTIONTo access all FIRMS managed fisheries reports available for NAFO, please look at: NAFO managed fisheries reports NAFO history In 1497, the historical expedition led by John Cabot discovered abundant resources of Atlantic cod (Gadus morhua) off Newfoundland. For a period of almost five centuries, this fishery supplied the world’s population with about 200 million tonnes of fish (www.nafo.int/about/frames/history.html). Cod was referred to as “Newfoundland currency” and constituted a large proportion of the fishery in the Northwest Atlantic until well into the twentieth century. The late 1800s and early 1900s saw the development of new fisheries for haddock (Melanogramus aeglefinus), mackerel (Scomber scombrus) and lobster (Homaris americanus). It also saw the beginning of fishery management in Area 21. Fishery research institutions at Woods Hole in the United States of America and the St Andrews Biological Station in Canada were the first to be established under the direction of new government departments (services) with a mandate of fishery management. The United States of America began to record the fishing ground of landings at major Atlantic coast ports in 1891. The first attempt at promoting and coordinating international marine fisheries research in the Northwest Atlantic was taken by the North American Council on Fishery Investigations in 1921. The first subdivision of the Northwest Atlantic for the purpose of collecting fishery statistics by area of capture was made in the early 1930s.
The most profound development in Northwest Atlantic fisheries occurred from the 1950s to the 1970s, when European and Asian distant-water fleets expanded into Northwest Atlantic waters. It resulted in a massive increase in effort and the development of numerous offshore fisheries. This prompted the formation of the International Convention for the Northwest Atlantic Fisheries to manage these emerging fisheries (Anderson, 1998). The number of contracting parties (countries) to this organization increased from the initial five (Canada, Denmark, Iceland, the United Kingdom of Great Britain and Northern Ireland, and the United States of America) in 1951 to a high of 18 by 1975. This reflected the large increase in fishing capacity and diversification of exploited species. These distant-water fleets were capable of fishing for months at a time without landing product. Fishing had previously been constrained near shore. Now, it was extended out to great depths for many new fisheries including deepwater species such as redfish (Sebastes sp.), Greenland halibut (Reinhardtius hippoglossoides), witch flounder (Glyplocephalus cynoglossus), and grenadiers (Macrouridae). As early as the 1960s, it was recognized that overfishing was taking place, but controls were limited because the harvest was taking place in international waters. In the late 1970s, as in other parts of the world, the coastal States in Area 21 extended jurisdiction out to 200 miles in order to gain control of the harvest. After supporting a sustainable fishery for more than five centuries, cod became severely depleted by the early 1990s. Catches were affected by a combination of factors besides heavy fishing that started in the 1960s. Environmental factors hypothesized to be involved included cold conditions linked to stronger Labrador Current flows, and a reduction in their key food (capelin [Mallotus villosus]). Seal predation and possibly low oxygen concentration have also been implicated in the decline of cod. In fact, cod were virtually gone on the northern extent of the Labrador Shelf (referred to as 2GH cod). This region had been unfished prior to the 1960s. A host of other demersal fish species such as American plaice (Hippoglossoides platessoides), redfish, Greenland halibut, witch flounder and grenadier species also collapsed in the same period. This indicated that environmental influences as well as overfishing played a role in the reduction of many commercial fish species.
Cod, American plaice, witch flounder, cusk (Brosme brosme), white hake (Urophycis tenuis) and grenadiers remain in low abundance in most parts of their range, even under moratoria or strict regulatory limitations. However, not all demersal fish underwent a decline in the early 1990s and some have recovered in recent years. For example, yellowtail flounder (Limanda ferruginea), particularly on the Grand Banks, has fully recovered to near virgin biomass. Populations of Atlantic halibut (Hippoglossus hippoglossus) and haddock (Melanogrammus aeglefinus) on the Scotian Shelf to Georges Bank have also grown in recent years. On the Georges Bank, declining gadoid resources that were replaced by elasmobranchs such as skates (Rajidae) and dogfish (Squalus acanthias) in the 1980s have begun to recover. Pelagic fish resources, primarily menhaden (Brevoortia tyrannus), herring (Clupea harengus) and Atlantic mackerel (Scomber scombrus) have continued to support fairly stable fisheries since the mid-1970s. They constitute about 23 percent of total reported landings in Area 21 since 2001. The key Georges Bank herring stock recovered in the 1990s from the overfishing in the 1970s. In contrast, invertebrate species, primarily shrimp (Pandalus sp.) and snow or queen crab (Chionoecetes opilio) both greatly increased their abundance and range in the 1980s and 1990s, particularly off Newfoundland and Labrador. Lobster (Homarus americanus) and sea scallop (Placopecten magellanicus) have increased slightly in the long term. These increases in shrimp and crab resources have supported emerging fisheries that have driven the total landed values to record highs in recent years. This has been despite the reduction in traditional demersal fish stocks. Shrimp and sea scallop fisheries have had the largest catch in Area 21 since 2001. This change in an ecosystem dominated by demersal fish species to one dominated by invertebrate species may have constituted a regime shift (Lilly, Parsons and Kulka, 2000, ICES, 2009). Following extension of jurisdiction to 200 miles in 1977, the principal northwest Atlantic fishing grounds came under coastal State jurisdiction. However, a significant portion of these fishing grounds also lies in international waters on the “nose” and “tail” of Grand Bank and on the Flemish Cap. This region comes under the jurisdiction of NAFO. There are 21 fisheries, including transboundary stocks that are managed by the 12 contracting parties of NAFO. Only 10 percent of the stocks under the mandate of NAFO are caught in the international waters. In the last decade, average catches within the national EEZs were of the order of 1.4 million tonnes per year whereas annual catches in the NAFO Regulatory Area averaged about 120 000 tonnes. Eleven species, namely Atlantic cod, American plaice, witch flounder, yellowtail flounder, Greenland halibut, capelin, squid, shrimp, thorny skate (the first time an elasmobranch species has been managed by an RFMO), white hake, redfish in Div. 3O and pelagic redfish in Subarea 2, Div. 1F+3K (south of Greenland), are managed mainly through TAC and quota allocation. Systems to monitor, control and survey the fisheries have been developed by NAFO. A precautionary framework has been developed to address uncertainties in the assessment of fish stocks. Long-term management and rebuilding plans are in place for stocks post-moratoria. There is joint inspection and surveillance conducted by contracting parties on behalf of NAFO. These consist of at-sea inspections, air surveillance and port inspections. An amended convention includes an ecosystem approach to fisheries management, and NAFO has closed five seamounts, a coral protection zone and 12 regions of significant coral and sponge concentration to demersal fishing. Further information on stocks under the NAFO mandate can be found in NAFO annual reports (NAFO, 2009, 2010) and on the NAFO Web site at www.nafo.int/publications/frames/publications.html FISHERIES UNDER JURISDICTION OF CANADAFor much of the past five centuries, the predominant fishery product from what are now Canadian waters was salted cod. The fish were originally caught by hook and line and gillnets from small vessels, and salted ashore. Starting in the seventeenth century, salting was also done at sea. It allowed fishing to be expanded offshore and resulted in a more efficient and widespread harvest (Fiedler, 1940). However, it was external influences, the development of steamer and trawler technology starting in the 1900s, that ultimately changed the nature of fisheries off Canada. In 1954, the United Kingdom of Great Britain and Northern Ireland introduced the factory stern trawler, allowing the vessel to fish long distances from home, and this technology was rapidly taken up by other countries. The banks off Canada were viewed as a prime target by the long-distance fleets, and the arrival of large numbers of factory trawlers from European and Asian countries resulted in a doubling of the catches in the 1960s. Although Canada had already implemented controls on the Canadian fleet, catches were largely unregulated for other countries, leading to decreased stock sizes. This prompted the extension of Canadian jurisdiction out to 200 miles in 1977. At that time, there was considerable optimism that Canadian catches would increase substantially under the national management system. Canada started to develop its own fleet of wet-fish trawlers in the late 1960s. After the extension of their jurisdiction, many of the trawl fisheries for cod, redfish and flatfish once prosecuted by the long-distance fleets, were taken over by Canadian interests. Non-Canadian fleets continued to be allocated a share of the quota but were phased out by the late 1980s. The Department of Fisheries and Oceans (DFO) expanded its management of the fisheries out to 200 miles. Straddling stocks were comanaged through NAFO (see NAFO section below). Stock assessments are used as the basis for providing scientific advice for quota management. Under the Fisheries Act, vessel licensing, seasonal permitting and quotas are enforced and monitored through fishery officer boardings and dockside inspections, quota monitoring and a fishery observer programme. Demersal fish species, Canadian watersFollowing extension of jurisdiction, some improvements in stock status of demersal fish, including cod were seen up to the mid-1980s. Thereafter, a combination of expanding Canadian offshore fishing capacity (which drove increased effort despite the supposedly conservative management system), overfishing by the distant-water fleets on the grounds outside the 200 miles jurisdiction and a succession of weak year classes in many fish stocks led to increases in fishing mortality and precipitous declines in stock sizes in the late 1980s and early 1990s. Many of the demersal finfish stocks, including cod, American plaice, witch flounder, yellowtail flounder and redfish collapsed, and fisheries for these species were closed or underwent sharp reductions in catch quotas in 1992 or 1993 (Murawski et al., 1997).
Conservative management measures since the collapse have had mixed results. In its 2003 report, the Fisheries Resource Conservation Council noted that the spawning biomass of cod in NAFO Divisions 2J3KL (northern cod) continued to be very low. It had poor recruitment, high mortality from seals and exposure to bycatch. Until recently, northern cod remained at less than 3 percent of its 1980s biomass, with few fish older than five years. However, from 2004 to 2008, the spawning stock biomass (SSB) increased by 83 percent per year. This is the first positive trend since the collapse in the early 1990s. However, the SSB still remains low: the average 2007–09 SSB offshore is 10 percent of the average in the 1980s. Whether this constitutes the start of recovery is unclear. Grand Bank cod (Div. 3NO, contiguous with northern cod) has not shown any sign of recovery. One of the possible causes is the relatively high fishing mortality on this depleted stock from bycatch in overlapping fisheries. The main fisheries where cod are taken as bycatch are the yellowtail flounder fishery inside 200 miles and in several fisheries in the NAFO Regulatory Area. Recruitment of this stock has also remained low for years, although from 2005–07, they have been similar to that seen in the 1980s.
All commercial populations of the cod of Canada’s northern (Div. 2J3KL), Laurentian (Div. 4RST and 3Ps) and southern cod (Div. 4X5YZjm) were assessed as “endangered” by the Committee on the Status of Endangered Wildlife in Canada (COSEWIC, 2011). This was because of their substantial declines in abundance and a lack of recovery. Although assessed at risk of extinction, these populations have not been placed on Schedule 1 of the Species at Risk Act, which would offer protection against harm. They continue to be managed under the Fisheries Act.
The failure of many demersal stocks to recover fully in the 18 or more years since they collapsed has puzzled those working on and interested in these fisheries. The stocks of these species have failed to recover despite most being closed to fishing. When the moratoria were placed on these stocks in the early 1990s, recovery was anticipated to take only a few years. Possible explanations have been proposed for cod by a Fisheries and Oceans review (Fisheries and Oceans Canada, 2003) but are also more broadly applicable to other fish stocks. Cod in northern Canada have lower productivity than elsewhere because they live in colder environments. In the 1990s, the ocean climate was unusually cold and unfavourable to productivity. Harsh conditions in the 1990s reduced survival and growth of cod. When the stocks collapsed, they underwent a severe reduction in SSB that resulted in a high proportion of first-time spawning fish. This reduced the reproductive potential of the stocks. Cod were small for their age and in poor condition with little energy reserves to survive critical stages. These reduced cod stocks were preyed upon by increasing numbers of seals, mackerel and herring. This combined mortality was sufficient to have affected recovery. While catches from fishing have been greatly reduced in comparison with the 1970s and 1980s, fishing mortality appears to have remained sufficiently high to hinder recovery. There was also evidence of under-reporting of catch, discarding of small fish and poaching. Invertebrate species, Canadian watersThe shrimp fishery in the Gulf of St. Lawrence began in the late 1960s, when landings rose gradually until a significant increase after 1990. Currently, the TAC for shrimp is 36 900 tonnes. In the 1970s and 1980s, a shrimp fishery was opened off Nova Scotia. However, it was closed on several occasions because of bycatch issues and currently has a TAC of 5 000 tonnes. It was elsewhere that the large shrimp resource was developed. In the 1970s, an exploratory fishing programme confirmed dense, widespread shrimp concentrations from Baffin Island to the northeast coast of Newfoundland. Canada bought a number of large factory freezer trawlers in the 1980s that were designed to trawl for shrimp. Between 1978 and 1991, 17 Canadian licences for an offshore fleet were issued and quotas established with an enterprise allocation regime. In the 1990s, as the abundance of the shrimp stocks grew and the groundfish moratorium came into effect, the fishery became increasingly lucrative. Inshore licences were introduced giving priority access to the < 65 ft (about 20 m) fleet and to firstnations fishers. The TAC rose from 85 000 tonnes in 1998 to more than 160 000 tonnes in 2007 and the fishery was extended south to the Grand Banks. Canadian catches of shrimp had been almost non-existent in the 1960s, yet they were now providing the largest catch in Canadian waters. Along with snow crab, shrimp now yield the greatest market value for the Canadian fishing industry. One of the issues that developed as the shrimp fishery expanded was the incidental capture of many of the declining demersal fish stocks. A fish exclusion device, the Nordmore grid, proved effective at reducing bycatch of adults of commercially important demersal fishes. In 1993, the device was made mandatory in the shrimp fishery. A full description of this fishery can be found on the Web site of Fisheries and Oceans Canada (2011).
Canadian participation in the offshore scallop fishery first began in the south on Georges Bank in the mid-1940s. When the 200-mile limit was introduced and the Canada/United States border was defined, Canada’s access to this stock was restricted. In 1973, management in the form of limited entry was introduced. The fishery is now under an integrated fishery management plan. Management measures include limited entry (no new licences), TACs, meat counts, electronic vessel monitoring, dockside monitoring of all landings and industry-managed closures to protect juvenile scallops. The offshore scallop fishery was recently certified as a sustainable fishery against the Marine Stewardship Council criteria. This indicates that scallop fisheries ranging from Georges Bank to St. Pierre Bank off southern Newfoundland are healthy and appropriately managed (Marine Stewardship Council, 2011). By value, scallop is the third-ranked species (behind lobster and crab) in Nova Scotia although the catch is small compared with shrimp, crab and lobster (7 000 tonnes). Herring, Canadian watersMany different types of management have been applied, including TAC, individual transferable quotas (ITQs) and limited entry. Most herring stocks are well below their historical averages, and two stocks are below or near the critical levels. The overall economic return from the fishery is limited as the price has changed little in the last 30 years. Despite this, the fishery is important to many fishers and processors. The long-term prospects for the fishery are uncertain given the status of the resource and the systemic problems of the industry. Nonetheless, the Fisheries Resource Conservation Council is convinced that greater benefit could be derived from the herring fishery (Fisheries Resource Conservation Council, 2009). FISHERIES UNDER JURISDICTION OF THE UNITED STATES OF AMERICAThe current United States harvest strategy must comply with the provisions of the Magnuson–Stevens Fishery Conservation and Management Act. Since the mid-1990s, particularly with the adoption of stronger management actions, fishing mortality has been reduced on most demersal fish stocks. Some stocks have started to rebuild relatively quickly (www.nefmc.org/press/press_releases/2010/GFStock%20Status2010%20(4).pdf). Management is based on a limit reference point framework. Accordingly, managers are required to maintain exploitation below FREBUILD that would lead to SSB reaching or exceeding the BMSY proxy within a ten-year rebuilding horizon. The SSB that is thought to result in the maximum projected recruitment, SSBMAX, is often used as a BMSY proxy. The recently formed Transboundary Resources Assessment Committee (www2.mar.dfo-mpo.gc.ca/science/trac/tsr.html) is a Canada/United States of America committee that assesses stock status of species that straddle the boundary of the two countries. Fisheries that are assessed by the committee include herring, cod, haddock, mackerel, yellowtail flounder and dogfish.
Much of the following information on stock status in the waters of the United States of America is derived from the Web site of the National Oceanic and Atmospheric Administration (NOAA) at www.nefsc.noaa.gov/nefsc/saw/ and www.nefsc.noaa.gov/publications/crd/ and information on fishery management can be found at the Web site of the New England Fishery Management Council (www.nefmc.org). Demersal species, Northeast coast of United States of AmericaThere are about 35 species (stocks) of demersal fish species caught off the northeast coast of the United States of America. Catches are dominated by goosefish (Lophius americanus also known as monkfish), gadoids (cod, haddock, pollock [Pollachius virens], silver and white hake), flounders (winter flounder [Pleuronectes americanus] and yellowtail flounder), spiny dogfish (Squalus acanthias), and skates. These species of skate are managed under the Skate Complex Fishery Skate Management Plan. The Northeast skate complex includes seven species: winter skate, barn-door skate, thorny skate, smooth skate, little skate, clear-nose skate, and rosette skate in the New England region. In the Mid-Atlantic region, catches consist mostly of summer flounder, scup (Stenotomus chrysops), goosefish and black sea bass (Centropristis striata). The average yield in the last decade of the principal demersal fish species, which includes goosefish, skates, Atlantic cod, silver hake, haddock, pollock, summer flounder, winter flounder and yellowtail flounder, scup, white hake, bluefish, witch, spiny dogfish and American plaice averaged 94 136 tonnes between 2001 and 2008. This amount is considerably less than their combined long-term potential yield. Some of these species have started to show some improvement in recent years as management has improved. Haddock catches had recovered to 8 242 tonnes by 2004, up from 328 tonnes in 1994 but declined again to 3 360 tonnes in 2007. However, cod catch was the lowest on record in 2006 at 5 724 tonnes, but showed a slight recovery to 8 659 tonnes in 2008. Invertebrate species, Atlantic waters of United States of AmericaSince 1982, the Atlantic Sea Scallop Fishery Management Plan (FMP) has regulated the fishery. Initially, regulations required vessels to land scallops that averaged fewer than 35 to 40 meats (the adductor muscle) per pound (about 450 g) or a minimum shell width of 3–3.5 inches (7.5–9.0 cm). However, fishing effort increased to unsustainable levels in the late 1980s and 1990s. This prompted the New England Fishery Management Council to develop Amendment 4 that became effective in 1994. Amendment 4 changed the management of scallop to achieve a maximum fishing mortality threshold equal to F5 percent. This threshold was believed to ensure recruitment by keeping SSB above 5 percent of virgin conditions. Also implemented were limited-access permits, day-atsea allocations, dredge ring-size minima, gear configuration restrictions to improve small scallop escapement, and a minimum mesh size to improve finfish escapement. United States sea scallop catches from the Georges Bank – Mid-Atlantic region have averaged 88 896 tonnes in the last decade with a high of 186 336 tonnes in 2002, indicating a recovery in the stocks. Large areas closed to protect demersal fish stocks have also contributed greatly to the recovery of sea scallops. Sources Marine and Inland Fisheries Service, Fisheries and Aquaculture Resources Use and Conservation Division. FAO Fisheries and Aquaculture Department “Review of the state of world marine fishery resources” . FAO FISHERIES AND AQUACULTURE TECHNICAL PAPER. No. 569. Rome, FAO. 2011.  http://www.fao.org/docrep/015/i2389e/i2389e.pdf http://www.fao.org/docrep/015/i2389e/i2389e.pdf Bibliography The bibliographic references are available through the hyperlink displayed in "Source of Information". ACKNOWLEDGEMENTSThe article beneficiated from constructive suggestions provided by H. Oxenford,P. Medley and J. Mendoza who are gratefully acknowledged for their inputs. Warmthanks to all those who provided useful information and documentation: J. Alió,F. Arocha, F. Blanchard, M.-J. Cardenas, F. Carocci, K. Cochrane, P. Fanning, A. Flores,L. Garibaldi, R. Lee, D. Lopez Sánchez, S. Lluch-Cota, J. Lopez, A. Mena Millar,D. Milton, R. Puga, L. Reynal, S. Singh-Renton, Y. Ye. The participants in the fifthsession of the WECAFC Scientific Advisory Group are also thanked for their comments:A. Acosta, R. Appeldoorn, N. Cummings, P. Debels, M. Haughton, L. Martínez,P. McConney, M. Perez Moreno, S. Salas Márquez, J.-C. Seijo, R. Van Anrooy. |
|
| |
|
|


