|
| Fact Sheet Title Fact Sheet |
| |
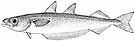
| Blue whiting - Northeast Atlantic |
 | Blue whiting (Micromesistius poutassou) in Subareas 1-9, 12, and 14 (Northeast Atlantic and adjacent waters) |
| | Data Ownership | | This document provided, maintained and owned by International Council for the Exploration of the Sea (ICES) , is part of ICES Advice data collection. |
|
| ident Block | ident Block | | | | Species List: | | Species Ref: en - Blue whiting(=Poutassou), fr - Merlan bleu, es - Bacaladilla, ar - غُبَر أزرق, zh - 小鳍鳕, ru - Путассу северная |
Fishery IndicatorsProduction: Landed Volume; Catch |
|
| ident Block Blue whiting - Northeast Atlantic Map tips - Click on
 to turn layers on and off to turn layers on and off - Double-click to zoom in
- Drag to pan
- Hold down the shift key and drag to zoom to a particular region
| fao Sub Area |
|---|
| 27.1 | Barents Sea (Subarea 27.1) |
|---|
| 27.2 | Norwegian Sea, Spitzbergen, and Bear Island (Subarea 27.2) |
|---|
| 27.3 | Skagerrak, Kattegat, Sound, Belt Sea, and Baltic Sea (Subarea 27.3) |
|---|
| 27.4 | North Sea (Subarea 27.4) |
|---|
| 27.5 | Iceland and Faroes Grounds (Subarea 27.5) |
|---|
| 27.6 | Rockall, Northwest Coast of Scotland and North Ireland (Subarea 27.6) |
|---|
| 27.7 | Irish Sea, West of Ireland, Porcupine Bank, Eastern and Western English Channel, etc (Subarea 27.7) |
|---|
| 27.8 | Bay of Biscay (Subarea 27.8) |
|---|
| 27.9 | Portuguese Waters (Subarea 27.9) |
|---|
| 27.12 | North of Azores (Subarea 27.12) |
|---|
| 27.14 | East Greenland (Subarea 27.14) |
|---|
|
|
|
|
|
| Aq Res | Biological Stock: Yes Value: Sub-Regional
Management unit: Yes Reference year: 2019
|
| Considered a management unit: An aquatic resource or fishery is declared as [Fishery] Management Unit if it is effectively the focus for the application of selected management methods and measures, within the broader framework of a management system. According to the FAO Glossary for Responsible Fishing, "a Fishery Management Unit (FMU) is a fishery or a portion of a fishery identified in a Fishery Management Plan (FMP) relevant to the FMP's management objectives." FMU's may be organised around fisheries biological, geographic, economic, technical, social or ecological dimensions , and the makeup and attribute of a fishery management unit depends mainly on the FMP's management objectives. |
| Jurisdictional distribution: Jurisdictional qualifier (e.g. "shared", "shared - highly migratory") of the aquatic resource related with its spatial distribution. |
| Environmental group: Classification of the aquatic resource according to the environmental group (e.g. pelagic invertebrate, or demersal fish) to which the species belong. |
| Reference Year: The Reference Year is the last year considered in the stock assessment and/or fishery status. |
| | | | | | Habitat Bio Depth Zone: Shelf (50 m - 200 m). Vertical Dist: Pelagic. Water Area Overview Spatial Scale: Sub-Regional Water Area Overview  | | Water Area Overview Blue whiting - Northeast Atlantic
| fao Sub Area | 27.1: Barents Sea (Subarea 27.1) | | 27.12: North of Azores (Subarea 27.12) | | 27.14: East Greenland (Subarea 27.14) | | 27.2: Norwegian Sea, Spitzbergen, and Bear Island (Subarea 27.2) | | 27.3: Skagerrak, Kattegat, Sound, Belt Sea, and Baltic Sea (Subarea 27.3) | | 27.4: North Sea (Subarea 27.4) | | 27.5: Iceland and Faroes Grounds (Subarea 27.5) | | 27.6: Rockall, Northwest Coast of Scotland and North Ireland (Subarea 27.6) | | 27.7: Irish Sea, West of Ireland, Porcupine Bank, Eastern and Western English Channel, etc (Subarea 27.7) | | 27.8: Bay of Biscay (Subarea 27.8) | | 27.9: Portuguese Waters (Subarea 27.9) |
| | | | | | Water Area Overview |
Water Area OverviewBlue whiting - Northeast Atlantic | fao Major | 27: Atlantic, Northeast | | Large Marine Ecosystem Areas (LME) | 19: East Greenland Shelf | | 20: Barents Sea | | 21: Norwegian Shelf | | 22: North Sea | | 23: Baltic Sea | | 24: Celtic-Biscay Shelf | | 25: Iberian Coastal | | 58: Kara Sea | | 59: East Greenland Shelf/Sea | | 60: Faroe Plateau | | 64: Arctic Ocean | | 65: Arctic Archipelago |
Aq Res Struct Biological Stock: Yes Exploit Fishery Indicators | Type | Measure | Value | Unit | Time period |
|---|
| Production | Landed Volume | 922980 | tonnes | 1981 | | Landed Volume | 550643 | tonnes | 1982 | | Landed Volume | 553344 | tonnes | 1983 | | Landed Volume | 615569 | tonnes | 1984 | | Landed Volume | 678214 | tonnes | 1985 | | Landed Volume | 847145 | tonnes | 1986 | | Landed Volume | 654718 | tonnes | 1987 | | Landed Volume | 552264 | tonnes | 1988 | | Landed Volume | 630316 | tonnes | 1989 | | Landed Volume | 558128 | tonnes | 1990 | | Landed Volume | 364008 | tonnes | 1991 | | Landed Volume | 474592 | tonnes | 1992 | | Landed Volume | 475198 | tonnes | 1993 | | Landed Volume | 457696 | tonnes | 1994 | | Landed Volume | 505176 | tonnes | 1995 | | Landed Volume | 621104 | tonnes | 1996 | | Landed Volume | 639681 | tonnes | 1997 | | Landed Volume | 1131955 | tonnes | 1998 | | Landed Volume | 1261033 | tonnes | 1999 | | Landed Volume | 1412449 | tonnes | 2000 | | Landed Volume | 1771805 | tonnes | 2001 | | Landed Volume | 1556955 | tonnes | 2002 | | Landed Volume | 2365319 | tonnes | 2003 | | Landed Volume | 2400795 | tonnes | 2004 | | Landed Volume | 2018344 | tonnes | 2005 | | Landed Volume | 1956239 | tonnes | 2006 | | Landed Volume | 1612269 | tonnes | 2007 | | Landed Volume | 1251851 | tonnes | 2008 | | Landed Volume | 634978 | tonnes | 2009 | | Landed Volume | 539539 | tonnes | 2010 | | Landed Volume | 103771 | tonnes | 2011 | | Landed Volume | 375692 | tonnes | 2012 | | Landed Volume | 613863 | tonnes | 2013 | | Landed Volume | 1147650 | tonnes | 2014 | | Landed Volume | 1390656 | tonnes | 2015 | | Landed Volume | 1180786 | tonnes | 2016 | | Landed Volume | 1555069 | tonnes | 2017 | | Landed Volume | 1709856 | tonnes | 2018 | | Landed Volume | 1444301 | tonnes | 2019 |
Fishery Indicators | Type | Measure | Value | Unit | Time period |
|---|
| Production | Catch | 922980 | tonnes | 1981 | | Catch | 550643 | tonnes | 1982 | | Catch | 553344 | tonnes | 1983 | | Catch | 615569 | tonnes | 1984 | | Catch | 678214 | tonnes | 1985 | | Catch | 847145 | tonnes | 1986 | | Catch | 654718 | tonnes | 1987 | | Catch | 552264 | tonnes | 1988 | | Catch | 630316 | tonnes | 1989 | | Catch | 558128 | tonnes | 1990 | | Catch | 364008 | tonnes | 1991 | | Catch | 474592 | tonnes | 1992 | | Catch | 475198 | tonnes | 1993 | | Catch | 457696 | tonnes | 1994 | | Catch | 505176 | tonnes | 1995 | | Catch | 621104 | tonnes | 1996 | | Catch | 639681 | tonnes | 1997 | | Catch | 1131955 | tonnes | 1998 | | Catch | 1261033 | tonnes | 1999 | | Catch | 1412449 | tonnes | 2000 | | Catch | 1771805 | tonnes | 2001 | | Catch | 1556955 | tonnes | 2002 | | Catch | 2365319 | tonnes | 2003 | | Catch | 2400795 | tonnes | 2004 | | Catch | 2018344 | tonnes | 2005 | | Catch | 1956239 | tonnes | 2006 | | Catch | 1612269 | tonnes | 2007 | | Catch | 1251851 | tonnes | 2008 | | Catch | 634978 | tonnes | 2009 | | Catch | 539539 | tonnes | 2010 | | Catch | 103771 | tonnes | 2011 | | Catch | 375692 | tonnes | 2012 | | Catch | 613863 | tonnes | 2013 | | Catch | 1147650 | tonnes | 2014 | | Catch | 1390656 | tonnes | 2015 | | Catch | 1180786 | tonnes | 2016 | | Catch | 1555069 | tonnes | 2017 | | Catch | 1709856 | tonnes | 2018 | | Catch | 1444301 | tonnes | 2019 |
Management Management unit: Yes Sources ICES Advice accessed through ICES Stock Assessment Database in 2020. ICES, Copenhagen.  http://standardgraphs.ices.dk/ViewCharts.aspx?key=13090 http://standardgraphs.ices.dk/ViewCharts.aspx?key=13090 |
|
| |
|