|
| Fact Sheet Title Fact Sheet |
| |
| Horse mackerel - Portuguese Waters East |
 | Horse mackerel (Trachurus trachurus) in Division 9.a (Atlantic Iberian waters) |
| | Data Ownership | | This document provided, maintained and owned by International Council for the Exploration of the Sea (ICES) , is part of ICES Advice data collection. |
|
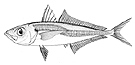
| ident Block | ident Block | | | | Species List: | | Species Ref: en - Atlantic horse mackerel, fr - Chinchard d'Europe, es - Jurel, ru - Ставрида обыкновенная |
Fishery IndicatorsProduction: Landed Volume; Catch |
|
| ident Block Horse mackerel - Portuguese Waters East Map tips - Click on
 to turn layers on and off to turn layers on and off - Double-click to zoom in
- Drag to pan
- Hold down the shift key and drag to zoom to a particular region
| fao Div |
|---|
| 27.9.a | Portuguese Waters - East (Division 27.9.a) |
|---|
|
|
|
|
|
| Aq Res | Biological Stock: Yes Value: Sub-Regional
Management unit: No Reference year: 2019
|
| Considered a management unit: An aquatic resource or fishery is declared as [Fishery] Management Unit if it is effectively the focus for the application of selected management methods and measures, within the broader framework of a management system. According to the FAO Glossary for Responsible Fishing, "a Fishery Management Unit (FMU) is a fishery or a portion of a fishery identified in a Fishery Management Plan (FMP) relevant to the FMP's management objectives." FMU's may be organised around fisheries biological, geographic, economic, technical, social or ecological dimensions , and the makeup and attribute of a fishery management unit depends mainly on the FMP's management objectives. |
| Jurisdictional distribution: Jurisdictional qualifier (e.g. "shared", "shared - highly migratory") of the aquatic resource related with its spatial distribution. |
| Environmental group: Classification of the aquatic resource according to the environmental group (e.g. pelagic invertebrate, or demersal fish) to which the species belong. |
| Reference Year: The Reference Year is the last year considered in the stock assessment and/or fishery status. |
| | | | | | Habitat Bio Depth Zone: Shelf (50 m - 200 m). Vertical Dist: Pelagic. Water Area Overview Spatial Scale: Sub-Regional Water Area Overview  | | Water Area Overview Horse mackerel - Portuguese Waters East
| fao Div | 27.9.a: Portuguese Waters - East (Division 27.9.a) |
| | | | | | Water Area Overview |
Water Area OverviewHorse mackerel - Portuguese Waters East Aq Res Struct Biological Stock: Yes Exploit Fishery Indicators | Type | Measure | Value | Unit | Time period |
|---|
| Production | Landed Volume | 27858 | tonnes | 1992 | | Landed Volume | 31521 | tonnes | 1993 | | Landed Volume | 28441 | tonnes | 1994 | | Landed Volume | 25147 | tonnes | 1995 | | Landed Volume | 20400 | tonnes | 1996 | | Landed Volume | 29491 | tonnes | 1997 | | Landed Volume | 41564 | tonnes | 1998 | | Landed Volume | 27733 | tonnes | 1999 | | Landed Volume | 26160 | tonnes | 2000 | | Landed Volume | 24910 | tonnes | 2001 | | Landed Volume | 22506 | tonnes | 2002 | | Landed Volume | 18887 | tonnes | 2003 | | Landed Volume | 23252 | tonnes | 2004 | | Landed Volume | 22695 | tonnes | 2005 | | Landed Volume | 23902 | tonnes | 2006 | | Landed Volume | 22790 | tonnes | 2007 | | Landed Volume | 22993 | tonnes | 2008 | | Landed Volume | 25737 | tonnes | 2009 | | Landed Volume | 26556 | tonnes | 2010 | | Landed Volume | 21875 | tonnes | 2011 | | Landed Volume | 24868 | tonnes | 2012 | | Landed Volume | 28993 | tonnes | 2013 | | Landed Volume | 29017 | tonnes | 2014 | | Landed Volume | 32723 | tonnes | 2015 | | Landed Volume | 40730 | tonnes | 2016 | | Landed Volume | 36946 | tonnes | 2017 | | Landed Volume | 31661 | tonnes | 2018 | | Landed Volume | 36536 | tonnes | 2019 |
Fishery Indicators | Type | Measure | Value | Unit | Time period |
|---|
| Production | Catch | 27858 | tonnes | 1992 | | Catch | 31521 | tonnes | 1993 | | Catch | 28441 | tonnes | 1994 | | Catch | 25147 | tonnes | 1995 | | Catch | 20400 | tonnes | 1996 | | Catch | 29491 | tonnes | 1997 | | Catch | 41564 | tonnes | 1998 | | Catch | 27733 | tonnes | 1999 | | Catch | 26160 | tonnes | 2000 | | Catch | 24910 | tonnes | 2001 | | Catch | 22506 | tonnes | 2002 | | Catch | 18887 | tonnes | 2003 | | Catch | 23252 | tonnes | 2004 | | Catch | 22695 | tonnes | 2005 | | Catch | 23902 | tonnes | 2006 | | Catch | 22790 | tonnes | 2007 | | Catch | 22993 | tonnes | 2008 | | Catch | 25737 | tonnes | 2009 | | Catch | 26556 | tonnes | 2010 | | Catch | 21875 | tonnes | 2011 | | Catch | 24868 | tonnes | 2012 | | Catch | 28993 | tonnes | 2013 | | Catch | 29017 | tonnes | 2014 | | Catch | 32723 | tonnes | 2015 | | Catch | 40730 | tonnes | 2016 | | Catch | 36946 | tonnes | 2017 | | Catch | 31661 | tonnes | 2018 | | Catch | 36536 | tonnes | 2019 |
Management Management unit: No Sources ICES Advice accessed through ICES Stock Assessment Database in 2020. ICES, Copenhagen.  http://standardgraphs.ices.dk/ViewCharts.aspx?key=13738 http://standardgraphs.ices.dk/ViewCharts.aspx?key=13738 |
|
| |
|