Norway lobster - Irish Sea|
| Fact Sheet Title Fact Sheet |
| | | Norway lobster - Irish Sea |
| | Data Ownership | | This document provided, maintained and owned by International Council for the Exploration of the Sea (ICES) , is part of ICES Advice data collection. |
| | ident Block | ident Block | | | | Species List: | | Species Ref: en - Norway lobster, fr - Langoustine, es - Cigala |
|
|
| ident Block Norway lobster - Irish Sea
Map tips
- Click on
 to turn layers on and off to turn layers on and off
- Double-click to zoom in
- Drag to pan
- Hold down the shift key and drag to zoom to a particular region
| fao Sub Area |
|---|
| 27.7 | Irish Sea, West of Ireland, Porcupine Bank, Eastern and Western English Channel, etc (Subarea 27.7) |
|---|
|
|
|
|
| | Aq Res | Biological Stock: Yes
Value: Sub-Regional
Management unit: Yes
Reference year: 2012
|
| Considered a management unit: An aquatic resource or fishery is
declared as [Fishery] Management Unit if it is
effectively the focus for the application of selected
management methods and measures, within the broader
framework of a management system. According to the FAO
Glossary for Responsible Fishing, "a Fishery Management
Unit (FMU) is a fishery or a portion of a fishery
identified in a Fishery Management Plan (FMP) relevant
to the FMP's management objectives." FMU's may be
organised around fisheries biological, geographic,
economic, technical, social or ecological dimensions ,
and the makeup and attribute of a fishery management
unit depends mainly on the FMP's management
objectives. |
| Jurisdictional distribution: Jurisdictional qualifier (e.g.
"shared", "shared - highly migratory") of the aquatic
resource related with its spatial distribution. |
| Environmental group: Classification of the aquatic
resource according to the environmental group (e.g.
pelagic invertebrate, or demersal fish) to which the
species belong. |
| Reference Year: The Reference Year is the last year considered in the stock assessment and/or fishery status. |
| | | | | | Habitat Bio Depth Zone: Shelf (50 m - 200 m). Vertical Dist: Demersal/Benthic. Nephrops is limited to muddy habitat, and requires sediment with a silt and clay content of between 10–100% to excavate its burrows. This means that the distribution of suitable sediment defines the species distribution. Adult Nephrops only undertake very small scale movements (a few 100 m) but larval transfer may occur between separate mud patches in some areas. This makes some stocks, particularly those with lower average density, vulnerable to localized depletion. Catch rates and composition vary daily and seasonally between different areas and sexes due to different emergence patterns and underlying population densities. After the onset of maturity male Nephrops grow faster and attain a large size than female. Density limits growth and grounds with high Nephrops density (>0.7/m 2) have smaller average size that those with low density. Environmental influence on the stockTemperature and hydrographic factors, particularly during the larval phase are critical to recruitment success in Nephrops. Some stocks in Division VII such as FU15 have well known and understood larval retention mechanisms (i.e. Western Irish Sea Gyre). Other stocks such as the Porcupine Bank have less well understood larval retention mechanisms. This results in very different population structure, productivity and vulnerability to fishing. Increasing water temperature leading to shorter larval development times is thought to improve recruitment in areas such as the Irish Sea. Increased storminess related to the NAO has also been linked to reduced recruitment and low catch rates several years later on the Porcupine Bank. Effects of the fisheries on the ecosystemTrawling for Nephrops results in bycatch and discards of other commercial species, including cod, haddock, whiting, hake, monkfish, and megrim. Given that 80 mm is the predominant mesh size used in Nephrops fisheries the resulting discard rates of small Nephrops and fish can be high. The high mud content and soft nature of Nephrops grounds means that trawling readily marks the seabed, trawl marks remaining visible for some time. Despite the high intensity of fishing (some areas are impacted >7 times/year) burrowing fauna can be seen re-emerging from freshly trawled grounds, implying that there is some resilience to trawling. Geo Dist Geo Dist: Shared between nations Water Area Overview Spatial Scale: Sub-Regional
Ecoregion: Celtic Sea.
Water Area Overview  | | Water Area Overview Norway lobster - Irish Sea
| fao Sub Area | 27.7: Irish Sea, West of Ireland, Porcupine Bank, Eastern and Western English Channel, etc (Subarea 27.7) |
| | | | | | Water Area Overview |
Water Area OverviewNorway lobster - Irish Sea Aq Res Struct Biological Stock: Yes Bio Assess Sci Advice A summary of the advice for all areas can be found in Table 5.4.34.1. There is no information available on the trends in the stock or exploitation status for FU18 and the rectangles outside the FUs (‘other rectangles’) for which ICES provides advice. ICES advises that the catches in the FU18 and other rectangles should not increase. Results 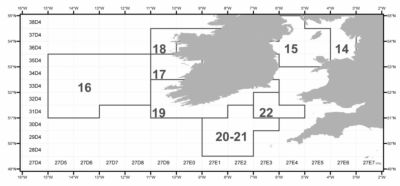 | Figure 5.4.34.1 Nephrops Functional Units in Subarea VII (around Ireland). The TAC for Subarea VII applies to the area bounded by the red line. The FUs within the TAC area are shaded.  |
 | | Table 5.4.34.2 Nephrops in Subarea VII. ICES estimates of landings (tonnes) from all individual Functional Units within TAC Subarea VII. |
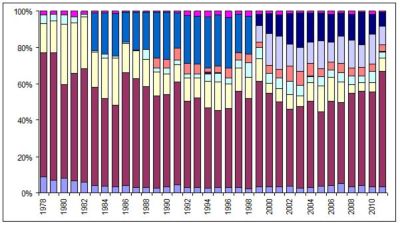
Table 5.4.34.2 Nephrops in Subarea VII. ICES estimates of landings (tonnes) from all individual Functional Units within TAC Subarea VII.
| Year |
FU 14 - Irish Sea East |
FU 15 - Irish Sea West |
FU 16 - Porcupine Bank |
FU 17 - Aran Grounds |
FU 18 - Ireland North West Coast |
FU 19 - Ireland South West and South East coast |
FUs 20-21+22 - Labadie & Smalls* |
FUs 20–21 - Labadie |
FU 22 -Smalls |
Other statistical rectangles Outside FUs |
Total Landings ICES Subarea VII |
TAC for VII |
| 1978 |
961 |
7,296 |
1,744 |
481 |
|
|
|
|
|
249 |
10,730 |
|
| 1979 |
900 |
8,948 |
2,269 |
452 |
|
|
|
|
|
237 |
12,807 |
|
| 1980 |
730 |
4,578 |
2,925 |
442 |
|
|
|
|
|
205 |
8,880 |
|
| 1981 |
829 |
7,249 |
3,381 |
414 |
|
|
|
|
|
382 |
12,255 |
|
| 1982 |
869 |
9,315 |
4,289 |
210 |
|
|
|
|
|
234 |
14,917 |
|
| 1983 |
763 |
9,448 |
3,426 |
131 |
|
|
3,667 |
|
|
174 |
17,609 |
|
| 1984 |
602 |
7,760 |
3,571 |
324 |
|
|
3,653 |
|
|
187 |
16,097 |
|
| 1985 |
498 |
6,901 |
3,919 |
207 |
|
|
3,599 |
|
|
194 |
15,317 |
|
| 1986 |
671 |
9,978 |
2,591 |
147 |
|
|
2,638 |
|
|
113 |
16,138 |
|
| 1987 |
449 |
9,753 |
2,499 |
62 |
|
|
3,409 |
|
|
107 |
16,279 |
24,700 |
| 1988 |
462 |
8,586 |
2,375 |
828 |
|
|
3,165 |
|
|
140 |
15,557 |
24,700 |
| 1989 |
401 |
8,128 |
2,115 |
344 |
|
899 |
4,005 |
|
|
134 |
16,026 |
26,000 |
| 1990 |
563 |
8,300 |
1,895 |
519 |
|
754 |
4,290 |
|
|
102 |
16,423 |
26,000 |
| 1991 |
747 |
9,554 |
1,640 |
410 |
|
1,077 |
3,295 |
|
|
169 |
16,892 |
26,000 |
| 1992 |
427 |
7,541 |
2,015 |
372 |
|
888 |
4,165 |
|
|
409 |
15,816 |
20,000 |
| 1993 |
515 |
8,102 |
1,857 |
372 |
10 |
905 |
4,358 |
|
|
455 |
16,573 |
20,000 |
| 1994 |
447 |
7,606 |
2,512 |
729 |
126 |
390 |
4,843 |
|
|
570 |
17,223 |
20,000 |
| 1995 |
584 |
7,796 |
2,936 |
866 |
26 |
695 |
5,198 |
|
|
397 |
18,498 |
23,000 |
| 1996 |
475 |
7,247 |
2,230 |
525 |
46 |
888 |
4,602 |
|
|
623 |
16,636 |
23,000 |
| 1997 |
566 |
9,971 |
2,409 |
841 |
15 |
756 |
3,991 |
|
|
340 |
18,889 |
23,000 |
| 1998 |
388 |
9,128 |
2,155 |
1,410 |
78 |
827 |
3,819 |
|
|
514 |
18,320 |
23,000 |
| 1999 |
624 |
10,786 |
2,289 |
1,140 |
16 |
579 |
|
1,710 |
1,152 |
322 |
18,618 |
23,000 |
| 2000 |
567 |
8,370 |
911 |
880 |
9 |
696 |
|
2,865 |
1,778 |
243 |
16,319 |
21,000 |
| 2001 |
532 |
7,441 |
1,222 |
913 |
2 |
815 |
|
2,903 |
1,833 |
368 |
16,029 |
18,900 |
| 2002 |
577 |
6,793 |
1,327 |
1,154 |
14 |
1,318 |
|
1,949 |
2,674 |
243 |
16,049 |
17,790 |
| 2003 |
376 |
7,065 |
907 |
933 |
16 |
1,239 |
|
2,050 |
2,953 |
186 |
15,726 |
17,790 |
| 2004 |
472 |
7,270 |
1,525 |
525 |
22 |
1,074 |
|
1,827 |
2,443 |
161 |
15,319 |
17,450 |
| 2005 |
570 |
6,554 |
2,312 |
778 |
15 |
711 |
|
2,426 |
2,469 |
180 |
16,015 |
19,544 |
| 2006 |
628 |
7,561 |
2,120 |
637 |
14 |
741 |
|
1,752 |
2,523 |
270 |
16,246 |
21,498 |
| 2007 |
959 |
8,491 |
2,186 |
913 |
3 |
957 |
|
2,886 |
2,419 |
206 |
19,020 |
25,153 |
| 2008 |
681 |
10,508 |
1,000 |
1,057 |
1 |
866 |
|
3,114 |
2,980 |
322 |
20,529 |
25153 |
| 2009 |
708 |
9,198 |
825 |
625 |
10 |
833 |
|
2,245 |
3,145 |
107 |
17,696 |
24650 |
| 2010 |
582 |
8,963 |
917 |
1,000 |
7 |
722 |
|
2,842 |
1,793 |
359 |
17,185 |
22432 |
| 2011 |
561 |
10,162 |
1,187 |
600 |
13 |
608 |
|
1,617 |
1,237 |
109 |
16,094 |
21759 |
| Average |
608 |
8,304 |
2,161 |
625 |
23 |
836 |
3,919 |
2,322 |
2,261 |
265 |
16,139 |
|
Assess Models Scientific basisThe assessments and advice for Nephrops stocks in Functional Units 14 and 15 (Irish Sea), 17 (Aran), 19 (southeast and southwest coast of Ireland) and 22 (the Smalls) are primarily based on abundance estimates from underwater TV (UWTV) surveys together with fishery landings data and estimates of quantities of discards. Additional indicators of changes in stocks are derived from trends in length compositions and sex ratio in the catches, fishery lpue, and (for FU15) trawl survey catch rates. The assessments and advice for FU 16 (Porcupine Bank) and FU 20–21 (Celtic Sea) are based on a range of indicators of stock trends including fishery lpue, trawl survey catch-rates, size compositions and sex ratio and the data limited approach. Management Management unit: Yes Advice Table 5.4.34.1 Nephrops in Subarea VII. ICES advice, management and landings by Functional Unit plus other rectangles.
| Year |
|
|
Predicted landings corresponding to ICES advice |
Agreed
TAC
|
ICES landings |
| |
Irish Sea East
(FU14)
|
Irish Sea West (FU15)
|
Porcupine Bank (FU16) |
Aran
Grounds
(FU17)
|
Ireland SW and SE Coast
(FU19)
|
Celtic Sea- Labadie
(FU20–21)
|
Celtic Sea- Smalls
FU22
|
Other rec-tangles
1)
|
|
|
| Division |
VIIa |
VIIb,c,j,k |
VIIg,h |
VIIg,f |
|
VII |
VII |
| 1992 |
8.9 |
3.8 |
~3.8 |
|
20.0 |
15.8 |
| 1993 |
9.4 |
~4.0 |
3.8 |
|
20.0 |
16.6 |
| 1994 |
9.4 |
~4.0 |
3.8 |
|
20.0 |
17.2 |
| 1995 |
9.4 |
~4.0 |
3.8 |
|
20.0 |
18.5 |
| 1996 |
9.4 |
4.0 |
3.8 |
|
23.0 |
16.6 |
| 1997 |
9.4 |
4.0 |
3.8 |
|
23.0 |
18.9 |
| 1998 |
9.4 |
4.0 |
3.8 |
|
23.0 |
18.3 |
| 1999 |
9.4 |
4.0 |
3.8 |
|
23.0 |
18.6 |
| 2000 |
9.4 |
4.0 |
3.8 |
|
21.0 |
16.3 |
| 2001 |
9.4 |
4.0 |
3.8 |
|
18.9 |
16.0 |
| 2002 |
9.55 |
4.44 |
3.8 |
|
17.79 |
16.0 |
| 2003 |
9.55 |
4.44 |
3.8 |
|
17.79 |
15.7 |
| 2004 |
9.55 |
3.3 |
4.6 |
|
17.45 |
15.3 |
| 2005 |
9.55 |
3.3 |
4.6 |
|
19.544 |
16.0 |
| 2006 |
9.55 |
3.3 |
4.6 |
|
21.498 |
16.2 |
| 2007 |
-2) |
-2) |
-3) |
-3) |
-3) |
-2) |
|
25.153 |
19.0 |
| 2008 |
-2) |
-2) |
-3) |
-3) |
-3) |
< 5.3 |
|
25.153 |
20.5 |
| 2009 |
<1.0 |
< 8.5 |
< 1.0 |
< 0.9 |
< 0.8 |
< 5.3 |
< 0.2 |
24.650 |
17.7 |
| 2010 |
<1.0 |
< 5.5 |
0 |
< 0.5 |
< 0.8 |
< 5.3 |
< 0.2 |
22.432 |
17.2 |
| 2011 |
<0.68 |
<9.5 |
0 |
<0.9 |
-4) |
-4) |
< 0.2 |
21.759 |
16.1 |
| 2012 |
<0.96 |
<9.8 |
-5) |
<1.1 |
-6) |
-6) |
<2.3 |
4) |
21.759 |
|
| 2013 |
<0.88 |
<9.3 |
<1.1 |
<0.89 |
<0.82 |
<2.5 |
<2.6 |
4) |
|
|
Weights in ‘000 t. 1) Prior to 2009, landings corresponding to advice for other rectangles and FU 18 were included with adjacent FUs. 2) No increase in effort. 3) Constrain effort to recent levels. 4) ICES provided advice based on MSY and Precautionary Scenarios 5) No increase in catches. 6) Reduce catches. Sources The above excerpts are from the first two pages of the ICES advice, the supporting information to this advice can be read in full at the following reference: ICES. Nephrops in Division VII. Report of the ICES Advisory Committee, 2012. ICES Advice, June 2012.  http://www.ices.dk/committe/acom/comwork/report/2012/2012/Nep-VII.pdf http://www.ices.dk/committe/acom/comwork/report/2012/2012/Nep-VII.pdf |
|
| |
|
|