|
| Fact Sheet Title Fact Sheet |
| |
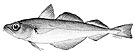
| Norway pout - West of Scotland |
 | Norway pout (Trisopterus esmarkii) in Division 6.a |
| | Data Ownership | | This document provided, maintained and owned by International Council for the Exploration of the Sea (ICES) , is part of ICES Advice data collection. |
|
| ident Block | ident Block | | | | Species List: | | Species Ref: en - Norway pout, fr - Tacaud norvégien, es - Faneca noruega, ru - Тресочка Эсмарка |
Fishery IndicatorsProduction: Landed Volume |
|
| ident Block Norway pout - West of Scotland Map tips - Click on
 to turn layers on and off to turn layers on and off - Double-click to zoom in
- Drag to pan
- Hold down the shift key and drag to zoom to a particular region
| fao Div |
|---|
| 27.6.a | Northwest Coast of Scotland and North Ireland or as the West of Scotland (Division 27.6.a) |
|---|
|
|
|
|
|
| Aq Res | Biological Stock: Yes Value: Sub-Regional
Management unit: Yes Reference year: 2017
|
| Considered a management unit: An aquatic resource or fishery is declared as [Fishery] Management Unit if it is effectively the focus for the application of selected management methods and measures, within the broader framework of a management system. According to the FAO Glossary for Responsible Fishing, "a Fishery Management Unit (FMU) is a fishery or a portion of a fishery identified in a Fishery Management Plan (FMP) relevant to the FMP's management objectives." FMU's may be organised around fisheries biological, geographic, economic, technical, social or ecological dimensions , and the makeup and attribute of a fishery management unit depends mainly on the FMP's management objectives. |
| Jurisdictional distribution: Jurisdictional qualifier (e.g. "shared", "shared - highly migratory") of the aquatic resource related with its spatial distribution. |
| Environmental group: Classification of the aquatic resource according to the environmental group (e.g. pelagic invertebrate, or demersal fish) to which the species belong. |
| Reference Year: The Reference Year is the last year considered in the stock assessment and/or fishery status. |
| | | | | | Habitat Bio Depth Zone: Shelf (50 m - 200 m). Vertical Dist: Demersal/Benthic. Water Area Overview Spatial Scale: Sub-Regional Water Area Overview  | | Water Area Overview Norway pout - West of Scotland
| fao Div | 27.6.a: Northwest Coast of Scotland and North Ireland or as the West of Scotland (Division 27.6.a) |
| | | | | | Water Area Overview |
Water Area OverviewNorway pout - West of Scotland | fao Major | 27: Atlantic, Northeast | | Large Marine Ecosystem Areas (LME) | 22: North Sea | | 24: Celtic-Biscay Shelf | | 60: Faroe Plateau |
Aq Res Struct Biological Stock: Yes Exploit Fishery Indicators | Type | Measure | Value | Unit | Time period |
|---|
| Production | Landed Volume | 0 | tonnes | 1970 | | Landed Volume | 1984 | tonnes | 1971 | | Landed Volume | 3943 | tonnes | 1972 | | Landed Volume | 11061 | tonnes | 1973 | | Landed Volume | 6845 | tonnes | 1974 | | Landed Volume | 8661 | tonnes | 1975 | | Landed Volume | 19933 | tonnes | 1976 | | Landed Volume | 5206 | tonnes | 1977 | | Landed Volume | 23250 | tonnes | 1978 | | Landed Volume | 20502 | tonnes | 1979 | | Landed Volume | 4800 | tonnes | 1980 | | Landed Volume | 7757 | tonnes | 1981 | | Landed Volume | 4911 | tonnes | 1982 | | Landed Volume | 1534 | tonnes | 1983 | | Landed Volume | 7724 | tonnes | 1984 | | Landed Volume | 1150 | tonnes | 1985 | | Landed Volume | 5832 | tonnes | 1986 | | Landed Volume | 38267 | tonnes | 1987 | | Landed Volume | 6742 | tonnes | 1988 | | Landed Volume | 28196 | tonnes | 1989 | | Landed Volume | 3316 | tonnes | 1990 | | Landed Volume | 4348 | tonnes | 1991 | | Landed Volume | 5158 | tonnes | 1992 | | Landed Volume | 7338 | tonnes | 1993 | | Landed Volume | 14148 | tonnes | 1994 | | Landed Volume | 24439 | tonnes | 1995 | | Landed Volume | 6322 | tonnes | 1996 | | Landed Volume | 9562 | tonnes | 1997 | | Landed Volume | 7186 | tonnes | 1998 | | Landed Volume | 4625 | tonnes | 1999 | | Landed Volume | 2005 | tonnes | 2000 | | Landed Volume | 3214 | tonnes | 2001 | | Landed Volume | 4819 | tonnes | 2002 | | Landed Volume | 6397 | tonnes | 2003 | | Landed Volume | 2285 | tonnes | 2004 | | Landed Volume | 0 | tonnes | 2005 | | Landed Volume | 32 | tonnes | 2006 | | Landed Volume | 0 | tonnes | 2007 | | Landed Volume | 0 | tonnes | 2008 | | Landed Volume | 0 | tonnes | 2009 | | Landed Volume | 0 | tonnes | 2010 | | Landed Volume | 0 | tonnes | 2011 | | Landed Volume | 0 | tonnes | 2012 | | Landed Volume | 0 | tonnes | 2013 | | Landed Volume | 8 | tonnes | 2014 | | Landed Volume | 1 | tonnes | 2015 | | Landed Volume | 0 | tonnes | 2016 | | Landed Volume | 13 | tonnes | 2017 |
Management Management unit: Yes Sources ICES Advice accessed through ICES Stock Assessment Database in 2021. ICES, Copenhagen.  http://standardgraphs.ices.dk/ViewCharts.aspx?key=9884 http://standardgraphs.ices.dk/ViewCharts.aspx?key=9884 |
|
| |
|