|
| Fact Sheet Title Fact Sheet |
| |
| Clyde herring - West of Scotland |
 | Clyde Herring (Division VIa) |
| | Data Ownership | | This document provided, maintained and owned by International Council for the Exploration of the Sea (ICES) , is part of ICES Advice data collection. |
|
| ident Block | ident Block | | | | Species List: | | Species Ref: en - Atlantic herring, fr - Hareng de l'Atlantique, es - Arenque del Atlántico, ru - Сельдь атлантическая |
|
|
| ident Block Clyde herring - West of Scotland
Map tips
- Click on
 to turn layers on and off to turn layers on and off
- Double-click to zoom in
- Drag to pan
- Hold down the shift key and drag to zoom to a particular region
| fao Div |
|---|
| 27.6.a | Northwest Coast of Scotland and North Ireland or as the West of Scotland (Division 27.6.a) |
|---|
|
|
|
|
|
| Aq Res | Biological Stock: Yes
Value: Sub-Regional
Management unit: Yes
Reference year: 2008
|
| Considered a management unit: An aquatic resource or fishery is
declared as [Fishery] Management Unit if it is
effectively the focus for the application of selected
management methods and measures, within the broader
framework of a management system. According to the FAO
Glossary for Responsible Fishing, "a Fishery Management
Unit (FMU) is a fishery or a portion of a fishery
identified in a Fishery Management Plan (FMP) relevant
to the FMP's management objectives." FMU's may be
organised around fisheries biological, geographic,
economic, technical, social or ecological dimensions ,
and the makeup and attribute of a fishery management
unit depends mainly on the FMP's management
objectives. |
| Jurisdictional distribution: Jurisdictional qualifier (e.g.
"shared", "shared - highly migratory") of the aquatic
resource related with its spatial distribution. |
| Environmental group: Classification of the aquatic
resource according to the environmental group (e.g.
pelagic invertebrate, or demersal fish) to which the
species belong. |
| Reference Year: The Reference Year is the last year considered in the stock assessment and/or fishery status. |
| | | | | | Aq Res State Trend
| Spawning biomass in relation to precautionary limits |
Fishing mortality in relation to precautionary limits |
Fishing mortality in relation to high long-term yield |
Fishing mortality in relation to
agreed target
|
Comment |
| Undefined |
Undefined |
Underfished |
Below target |
|
In the absence of precautionary reference points the state of the stock cannot be evaluated. An analytical assessment shows that SSB (in 2009) is 1.8 times B lim. ICES considers that the stock over recent years has been fluctuating at a low level and is being exploited close to F msy. Recruitment has been very low since 1998, and the 2001 and 2002 year classes are weak. Habitat Bio Depth Zone: Shelf (50 m - 200 m). Vertical Dist: Pelagic. Geo Dist Geo Dist: National Water Area Overview Spatial Scale: Sub-Regional Water Area Overview  | | Water Area Overview Clyde herring - West of Scotland
| fao Div | 27.6.a: Northwest Coast of Scotland and North Ireland or as the West of Scotland (Division 27.6.a) |
| | | | | | Water Area Overview |
Water Area OverviewClyde herring - West of Scotland | fao Major | 27:
Atlantic, Northeast | | Large Marine Ecosystem Areas (LME) | 22: North Sea | | 24: Celtic-Biscay Shelf | | 60: Faroe Plateau |
Aq Res Struct Biological Stock: Yes Exploit Factors affecting the fisheries and the stockChanges in fishing technology and fishing patternsHistorically, catches have been taken from this area by three fisheries: - A Scottish domestic pair trawl fleet and the Northern Irish fleet operated in shallower, coastal areas, principally fishing in the Minches and around the Island of Barra in the south; younger herring are found in these areas. This fleet has reduced in recent years.
- The Scottish single-boat trawl and purse-seine fleets, with refrigerated seawater tanks, targeting herring mostly in the northern North Sea, but also operating in the northern part of Division VIaN. This fleet now operates mostly with trawls, but many vessels can deploy either gear.
- An international freezer-trawler fishery has historically operated in deeper water near the shelf edge where older fish are distributed. These vessels are mainly registered in the Netherlands, Germany, France, and England, but most are Dutch owned.
In recent years the age structure of the catch of these last two fleets has become more similar. Impacts of the environment on the fish stockTemperatures in this area have been increasing over recent decades. There are indications that salinity is also increasing. It is considered that this may have implications for herring. It is known that similar environmental changes have affected the North Sea herring. There is evidence that there have been recent changes of the productivity of the Division VIaN stock. Herring are thought to be a source of food for seals. A recent study of seal diets off western Scotland revealed that grey seals may be an important predator for herring in this area. The numbers of seals in Division VIaN is thought to have increased over the last decades. The seal consumption of herring is estimated with great uncertainty and the impact of increased predation is not known, but there is a possibility that seal predation could influence natural mortality. Bio Assess Assess Models Methodology Scientific basisData and methodsAnalytic assessment using catch data and data from one acoustic survey. The acoustic survey used to tune the assessment has been re-evaluated and found to provide a useful, but noisy signal for tuning the assessment. Uncertainties in assessment and forecastThe assessment is considered to be noisy, but unbiased. Medium-term evaluations of the management plan have been carried out assuming the same level of noise as seen in the assessment. Risks of SSB<B lim are expected to be low if the management is followed. Comparison with previous assessment and adviceThis year’s assessment is revised upwards compared to last year’s, with F 37% lower and SSB 49% higher compared to 2008 values. The basis for the advice has changed from last year, a reduction in TAC, to this year’s advice for an increase in catch in line with the agreed management plan. Results 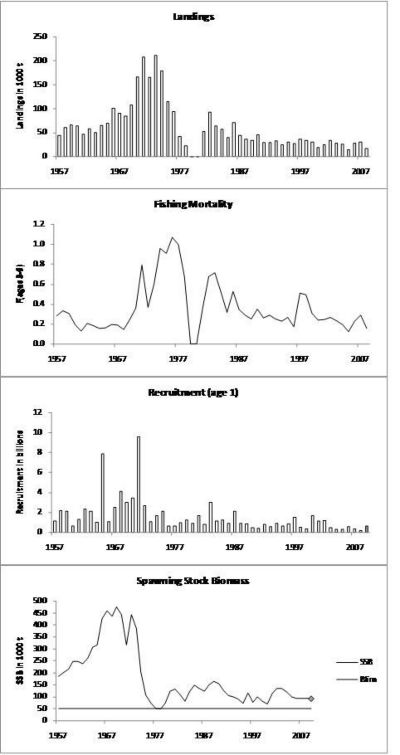 | Figure 5.4.30.1 Herring in Division VIa North. Landings, fishing mortality, recruitment, and SSB. Estimates are marked in grey  |
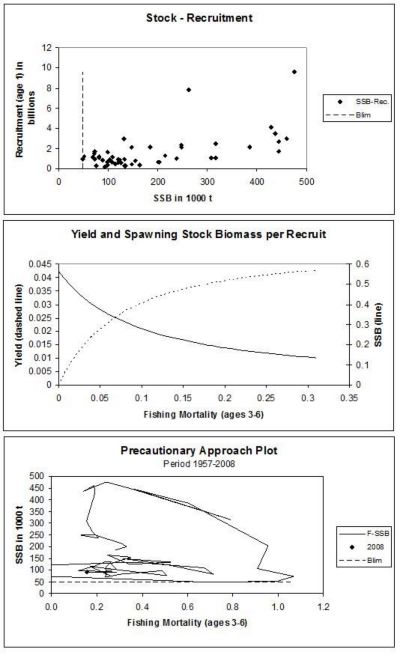 | | Figure 5.4.30.2 Herring in Division VIa North. Stock and recruitment, yield, and precautionary approach |
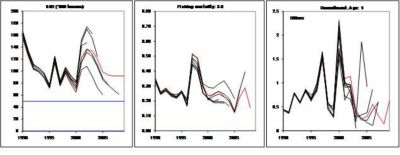 | | Figure 5.4.30.3 Herring in Division VIa North. Historical performance of the assessments. Note: assessments prior to 2001 not comparable with recent assessments. |
Table 5.4.30.2 Herring in Division VIa North. Catch in tonnes by country, 1985–2008. These figures do not correspond in all cases to the official statistics and cannot be used for management purposes.
| Country |
1985 |
1986 |
1987 |
1988 |
1989 |
1990 |
1991 |
1992 |
| Denmark |
|
|
|
|
|
|
|
|
| Faroes |
104 |
400 |
|
|
|
326 |
482 |
|
| France |
20 |
18 |
136 |
44 |
1 342 |
1 287 |
1 168 |
119 |
| Germany |
5 937 |
2 188 |
1 711 |
1 860 |
4 290 |
7 096 |
6 450 |
5 640 |
| Ireland |
|
6 000 |
6 800 |
6 740 |
8 000 |
10 000 |
8 000 |
7 985 |
| Netherlands |
5 500 |
5 160 |
5 212 |
6 131 |
5 860 |
7 693 |
7 979 |
8 000 |
| Norway |
4 690 |
4 799 |
4 300 |
456 |
|
1 607 |
3 318 |
2 389 |
| UK |
28 065 |
25 294 |
26 810 |
26 894 |
29 874 |
38 253 |
32 628 |
32 730 |
| Unallocated |
-502 |
37 840 |
18 038 |
5 229 |
2 123 |
2 397 |
-10 597 |
-5 485 |
| Discards |
|
|
|
|
1 550 |
1 300 |
1 180 |
200 |
| Total |
43 814 |
81 699 |
63 007 |
47 354 |
53 039 |
69 959 |
50 608 |
51 578 |
| Area-Misreported |
-4 672 |
-10 935 |
-18 647 |
-11 763 |
-19 013 |
-25 266 |
-22 079 |
-22 593 |
| WG Estimate |
39 142 |
70 764 |
44 360 |
35 591 |
34 026 |
44 693 |
28 529 |
28 985 |
| Source (WG) |
1987 |
1988 |
1989 |
1990 |
1991 |
1993 |
1993 |
1994 |
| |
| Country |
1993 |
1994 |
1995 |
1996 |
1997 |
1998 |
1999 |
2000 |
| Faroes |
|
|
|
|
|
|
|
|
| France |
818 |
274 |
3 672 |
2 297 |
3 093 |
1 903 |
463 |
870 |
| Germany |
4 693 |
5 087 |
3 733 |
7 836 |
8 873 |
8 253 |
6 752 |
4 615 |
| Ireland |
8 236 |
7 938 |
3 548 |
9 721 |
1 875 |
11 199 |
7 915 |
4 841 |
| Netherlands |
6 132 |
6 093 |
7 808 |
9 396 |
9 873 |
8 483 |
7 244 |
4 647 |
| Norway |
7 447 |
8 183 |
4 840 |
6 223 |
4 962 |
5 317 |
2 695 |
|
| UK |
32 602 |
30 676 |
42 661 |
46 639 |
44 273 |
42 302 |
36 446 |
22 816 |
| Unallocated |
-3 753 |
-4 287 |
-4 541 |
-17 753 |
-8 015 |
-11 748 |
-8 155 |
|
| Discards |
|
700 |
|
|
62 |
90 |
|
|
| Total |
56 175 |
54 664 |
61 271 |
64 359 |
64 995 |
65 799 |
61 514 |
37 789 |
| Area-Misreported |
-24 397 |
-30 234 |
-32 146 |
-38 254 |
-29 766 |
-32 446 |
-23 623 |
-19 467 |
| WG Estimate |
31 778 |
24 430 |
29 575 |
26 105 |
35 233 |
33 353 |
29 736 |
18 322 |
| Source (WG) |
1995 |
1996 |
1997 |
1997 |
1998 |
1999 |
2000 |
2001 |
| |
| Country |
2001 |
2002 |
2003 |
2004 |
2005 |
2006 |
2007 |
2008 |
| Faroes |
|
800 |
400 |
228 |
1 810 |
570
|
484 |
927 |
| France |
760 |
1 340 |
1 370 |
625 |
613 |
701 |
703 |
564 |
| Germany |
3 944 |
3 810 |
2 935 |
1 046 |
2 691 |
3 152 |
1 749 |
2 526 |
| Ireland |
4 311 |
4 239 |
3 581 |
1 894 |
2 880 |
4 352 |
5 129 |
3 103 |
| Netherlands |
4 534 |
4 612 |
3 609 |
8 232 |
5 132 |
7 008 |
8 052 |
4 133 |
| Norway |
|
|
|
|
|
|
|
|
| UK |
21 862 |
20 604 |
16 947 |
17 706 |
17 494 |
18 284 |
17 618 |
13 963 |
| Unallocated |
|
878 |
-7 |
|
|
|
|
|
| Discards |
|
|
|
123 |
772 |
163 |
|
|
| Total |
35 411 |
36 283 |
28 835 |
29 854 |
31 392 |
34 230 |
33 735 |
25 216 |
| Area-Misreported |
-11 132 |
-8 735 |
-3 581 |
-7 218 |
-17 263 |
-6 884 |
-4 119 |
-9 162 |
| WG Estimate |
24 556 |
32 914 |
28 081 |
25 021 |
14 129 |
27 346 |
29 616 |
16 054 |
| Source (WG) |
2002 |
2003 |
2004 |
2005 |
2006 |
2007 |
2008 |
2009 |
Table 5.4.30.3 Herring in Division VIa North. Summary of stock assessment.
|
Year
|
Recruitment
Age 1
Thousands
|
SSB
tonnes
|
Landings
tonnes
|
Mean F
Ages 3-6
|
| 1957 |
1085415 |
184542 |
43438 |
0.2833 |
| 1958 |
2129925 |
200966 |
59669 |
0.3315 |
| 1959 |
2124103 |
214361 |
65221 |
0.3043 |
| 1960 |
628969 |
248252 |
63759 |
0.1948 |
| 1961 |
1282671 |
248296 |
46353 |
0.1290 |
| 1962 |
2323456 |
237651 |
58195 |
0.2055 |
| 1963 |
2128325 |
261562 |
49030 |
0.1830 |
| 1964 |
979318 |
307678 |
64234 |
0.1530 |
| 1965 |
7855652 |
316322 |
68669 |
0.1580 |
| 1966 |
1065520 |
427781 |
100619 |
0.1920 |
| 1967 |
2499919 |
460184 |
90400 |
0.1885 |
| 1968 |
4100323 |
437487 |
84614 |
0.1425 |
| 1969 |
2998830 |
475825 |
107170 |
0.2415 |
| 1970 |
3440170 |
444140 |
165930 |
0.3580 |
| 1971 |
9572399 |
316111 |
207167 |
0.7885 |
| 1972 |
2675839 |
443971 |
164756 |
0.3648 |
| 1973 |
1074339 |
385359 |
210270 |
0.6055 |
| 1974 |
1672283 |
204084 |
178160 |
0.9570 |
| 1975 |
2101533 |
107141 |
114001 |
0.9093 |
| 1976 |
608221 |
73429 |
93642 |
1.0677 |
| 1977 |
621969 |
51907 |
41341 |
0.9935 |
| 1978 |
913517 |
48526 |
22156 |
0.6767 |
| 1979 |
1216369 |
72378 |
60 |
0.0008 |
| 1980 |
885405 |
122146 |
306 |
0.0002 |
| 1981 |
1660598 |
131858 |
51420 |
0.3623 |
| 1982 |
770261 |
109542 |
92360 |
0.6750 |
| 1983 |
2977418 |
81150 |
63523 |
0.7137 |
| 1984 |
1132203 |
120051 |
56012 |
0.5182 |
| 1985 |
1199475 |
147680 |
39142 |
0.3157 |
| 1986 |
887707 |
133119 |
70764 |
0.5272 |
| 1987 |
2097344 |
123340 |
44360 |
0.3442 |
| 1988 |
899294 |
147822 |
35591 |
0.2858 |
| 1989 |
844942 |
163947 |
34026 |
0.2480 |
| 1990 |
433443 |
154485 |
44693 |
0.3500 |
| 1991 |
380590 |
125793 |
28529 |
0.2610 |
| 1992 |
792557 |
102884 |
28985 |
0.2858 |
| 1993 |
580372 |
98509 |
31778 |
0.2482 |
| 1994 |
869256 |
89016 |
24430 |
0.2280 |
| 1995 |
631358 |
71728 |
29575 |
0.2660 |
| 1996 |
835046 |
115212 |
26105 |
0.1703 |
| 1997 |
1491824 |
75352 |
35233 |
0.5070 |
| 1998 |
481352 |
98427 |
33353 |
0.4900 |
| 1999 |
305133 |
81928 |
29736 |
0.3025 |
| 2000 |
1636643 |
69449 |
18322 |
0.2367 |
| 2001 |
1090588 |
113982 |
24556 |
0.2410 |
| 2002 |
1143083 |
134943 |
32914 |
0.2667 |
| 2003 |
434105 |
133947 |
28081 |
0.2315 |
| 2004 |
251977 |
119690 |
25021 |
0.1948 |
| 2005 |
299915 |
98238 |
14129 |
0.1202 |
| 2006 |
554435 |
93270 |
27346 |
0.2273 |
| 2007 |
323159 |
91848 |
29616 |
0.2875 |
| 2008 |
145843 |
91884 |
16054 |
0.1555 |
| 2009 |
629205* |
91933 |
|
|
| Average |
1542709 |
179267 |
59900 |
0.3556 |
| * geometric mean 1989-2006 |
Ref Point
| |
Type |
Value |
Technical basis |
| Precautionary approach |
Blim |
50 000 t |
Lowest reliable estimate of SSB |
| |
Bpa |
Not defined |
|
| |
Flim |
Not defined |
|
| |
Fpa |
Not defined |
|
| Targets |
Fmgt |
0.25 |
HCR Simulations Fmsy HAWG 2005 |
| Unchanged since 2005 |
Yield and spawning biomass per Recruit F-reference points:
| |
Fish Mort
Ages 3-6
|
Yield/R
|
SSB/R
|
| Average last 3 years |
0.22 |
0.04 |
0.17 |
| F0.1 |
0.17 |
0.04 |
0.20 |
| Fmed |
0.27 |
0.04 |
0.15 |
Projection Basis: F (2009) = F (TAC 2009) = 0.23; SSB (2009) 1 = 92 t; landings (2009) = 21.76; R(09-11) = (GM89-06) = 629.2 million Outlook for 2010
| Rationale |
Catches (2010) |
SSB (2010)1 |
Basis |
F
(2010)
|
SSB
(2011)
|
% TAC change2 |
| Zero catch |
0 |
108 |
F=0 |
0 |
130 |
-100% |
| Management plan F=0.25 |
24.42 |
94 |
Fsq*1.08 |
0.25 |
96 |
+12% |
| Status quo options |
17.63 |
98 |
Fsq*0.74 |
0.17 |
110 |
-20% |
| |
21.76 |
96 |
Fsq*0.95 |
0.22 |
99 |
0% |
| |
26.15 |
93 |
Fsq*1.17 |
0.27 |
93 |
+20% |
| |
28.69 |
91 |
Fsq*1.52 |
0.35 |
90 |
+32% |
| |
32.83 |
89 |
Fsq*1.74 |
0.40 |
85 |
+51% |
|
Weights in ‘000 tonnes.
Shaded scenarios are not considered consistent with the management plan.
1) For autumn spawning stocks, the SSB is determined at spawning time and is influenced by fisheries between 1 January and spawning.
2) TAC 2010 relative to TAC 2009
|
Sci Advice Single-stock exploitation boundariesConsidering the options below, ICES advises on the basis of the agreed management plan. This corresponds to catches weighing no more than 24 420 tonnes in 2010. Exploitation boundaries in relation to the proposed management planFollowing the agreed management plan implies catches of no more than 24 420 tonnes in 2010, which is expected to lead to an SSB of 94 000 t in 2011. The agreed management plan is consistent with the precautionary approach. Exploitation boundaries in relation to high long-term yield, low risk of depletion of production potential and considering ecosystem effectsFishing mortality in the range of the target mortality of the proposed management plan is expected to give a high long-term yield and a low risk of stock depletion. Exploitation boundaries in relation to precautionary limitsPrecautionary reference points for fishing mortality have not been defined for this stock. Any management measures should have a high probability of avoiding B lim. Table 5.4.30.1 Herring in Division VIa North. Single stock exploitation boundaries (advice), management, and catches.
Year |
ICES
Advice
|
Predicted catch
corresp. to advice
|
Agreed
TAC
|
Disc.
slip.
|
ICES
Catch1
|
| 1987 |
Reduce F to F0.1/status quo F |
38–55 |
49.7 |
|
44 |
| 1988 |
TAC |
46 |
49.8 |
|
36 |
| 1989 |
TAC |
58 |
58 |
1.6 |
34 |
| 1990 |
TAC |
61 |
75 |
1.3 |
45 |
| 1991 |
TAC |
57 |
62 |
1.2 |
29 |
| 1992 |
TAC |
62 |
62 |
0.2 |
29 |
| 1993 |
Catch at status quo F |
54–58 |
62 |
0.8 |
32 |
| 1994 |
Catch at status quo F |
50–60 |
62 |
0.7 |
24 |
| 1995 |
No specific advice |
602 |
77 |
|
30 |
| 1996 |
No advice because of misreporting |
- |
83.57 |
|
26 |
| 1997 |
Catch at status quo F |
|
83.57 |
0.1 |
333 |
| 1998 |
Catch at status quo F |
59 |
80.37 |
0.9 |
33
|
| 1999 |
Average catches, 1991–1996 |
28 |
68 |
|
30 |
| 2000 |
Average catches, 1991–1996 |
28 |
42 |
|
184 |
| 2001 |
Average catches, 1991–1999 |
30 |
36.36 |
|
244 |
| 2002 |
Average catches, 1991–1999 |
30 |
36.36 |
|
334 |
| 2003 |
Catch at status quo F |
30 |
30 |
|
284 |
| 2004 |
F=0.30 |
41 |
30 |
0.1 |
254 |
| 2005 |
Catch at status quo F |
30 |
30.1 |
|
144 |
| 2006 |
Catch at status quo F |
34 |
34 |
|
27 |
| 2007 |
Status quo TAC advice |
34 |
34 |
|
30 |
| 2008 |
F = 0.2 (proposed management plan) |
15 |
27.2 |
|
16 |
| 2009 |
F =0.2 (proposed management plan) |
13 |
21.76 |
|
|
| 2010 |
F 0.25 (agreed management plan) |
24 |
|
|
|
|
Weights in ‘000 t.
1) Adjusted for misreporting.
2) Catch at status quo F.
3) Revised in 1999.
4) Revised in 2007.
|
Management Management unit: Yes Objectives The EU adopted a management plan on 18 December 2008 (Council Regulation (EC) 1300/2008) based on the following rule;
| SSB in the year of the TAC |
Fishing mortality |
TAC constraint |
| SSB > 75 000 t |
F = 0.25 |
20% |
| SSB < 75 000 t |
F = 0.2 |
20% |
| SSB < 62 500 t |
F = 0.2 |
25% |
| SSB < 50 000 t (Blim) |
F = 0 |
- |
A similar proposed management plan was evaluated by ICES in 2005 and found to be consistent with the precautionary approach. In 2008 ICES checked that the recent changes in stock dynamics and the changes to the plan had not significantly increased the risks. ICES gives advice based on the management plan. Advice Management considerationsThere has been considerable uncertainty in the amount of landings from this stock in the past. Area misreporting continues to be a problem, with almost all countries taking catches of herring in other areas and reporting it into VIa North. However, routine use of VMS has reduced the problem. The assessment is noisy, leading to annual revisions of SSB and F. The management plan has been designed to cope with this by applying a constraint on year on year change in TAC. Revisions in SSB can be upwards or downwards, so it is important to maintain the restrictions on change in TAC both when the stock is revised upwards or downwards. Asymmetrical responses have not been tested and may be significantly more risky. The stock identity of herring west of the British Isles was reviewed by the EU-funded project WESTHER. This identified Division VIaN as an area where catches comprise a mixture of fish from Divisions VIaN, VIaS, and VIIaN. Concerning the management plan for Division VIaN, ICES has advised that herring components should be managed separately to afford maximum protection and optimal yield. If there is an increasing catch on the mixed fishery in Division VIaN, this should be considered in the management of the Division VIaS component, which is in a depleted state. In 2008 ICES began to evaluate management for this Division VIa(south) and VIIa(north). It will be a number of years before ICES can provide a fully operational integrated strategy for these units. In this context ICES recommends that the management plans for Division VIaN should be continued. Impacts of fisheries on the ecosystemsHerring are an important prey species in the ecosystem and also one of the dominant planktivorous fish. Herring fisheries tend to be clean with little bycatch of other fish. Scottish discard observer programmes since 1999 indicate that discarding of herring in these directed fisheries are at a low level. These discard observer programmes have recorded occasional catches of seals and zero catches of cetaceans. Herring fisheries rarely disturb the seabed. Sources ICES.2009.Report of the ICES Advisory Committee, 2009. ICES Advice, 2009. |
|
| |
|