|
| Fact Sheet Title Fact Sheet |
| |
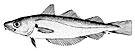
| Whiting - West of Scotland |
 | Whiting (Merlangius merlangus) in Division 6.a (West of Scotland) |
| | Data Ownership | | This document provided, maintained and owned by International Council for the Exploration of the Sea (ICES) , is part of ICES Advice data collection. |
|
| ident Block | ident Block | | | | Species List: | | Species Ref: en - Whiting, fr - Merlan, es - Plegonero, ru - Мерланг |
Fishery IndicatorsProduction: Landed Volume; Catch |
|
| ident Block Whiting - West of Scotland Map tips - Click on
 to turn layers on and off to turn layers on and off - Double-click to zoom in
- Drag to pan
- Hold down the shift key and drag to zoom to a particular region
| fao Div |
|---|
| 27.6.a | Northwest Coast of Scotland and North Ireland or as the West of Scotland (Division 27.6.a) |
|---|
|
|
|
|
|
| Aq Res | Biological Stock: Yes Value: Sub-Regional
Management unit: Yes Reference year: 2015
|
| Considered a management unit: An aquatic resource or fishery is declared as [Fishery] Management Unit if it is effectively the focus for the application of selected management methods and measures, within the broader framework of a management system. According to the FAO Glossary for Responsible Fishing, "a Fishery Management Unit (FMU) is a fishery or a portion of a fishery identified in a Fishery Management Plan (FMP) relevant to the FMP's management objectives." FMU's may be organised around fisheries biological, geographic, economic, technical, social or ecological dimensions , and the makeup and attribute of a fishery management unit depends mainly on the FMP's management objectives. |
| Jurisdictional distribution: Jurisdictional qualifier (e.g. "shared", "shared - highly migratory") of the aquatic resource related with its spatial distribution. |
| Environmental group: Classification of the aquatic resource according to the environmental group (e.g. pelagic invertebrate, or demersal fish) to which the species belong. |
| Reference Year: The Reference Year is the last year considered in the stock assessment and/or fishery status. |
| | | | | | Habitat Bio Depth Zone: Shelf (50 m - 200 m). Vertical Dist: Demersal/Benthic. Water Area Overview Spatial Scale: Sub-Regional Water Area Overview  | | Water Area Overview Whiting - West of Scotland
| fao Div | 27.6.a: Northwest Coast of Scotland and North Ireland or as the West of Scotland (Division 27.6.a) |
| | | | | | Water Area Overview |
Water Area OverviewWhiting - West of Scotland | fao Major | 27: Atlantic, Northeast | | Large Marine Ecosystem Areas (LME) | 22: North Sea | | 24: Celtic-Biscay Shelf | | 60: Faroe Plateau |
Aq Res Struct Biological Stock: Yes Exploit Fishery Indicators | Type | Measure | Value | Unit | Time period |
|---|
| Production | Landed Volume | 12194 | tonnes | 1981 | | Landed Volume | 13880 | tonnes | 1982 | | Landed Volume | 15962 | tonnes | 1983 | | Landed Volume | 16459 | tonnes | 1984 | | Landed Volume | 12879 | tonnes | 1985 | | Landed Volume | 8458 | tonnes | 1986 | | Landed Volume | 11542 | tonnes | 1987 | | Landed Volume | 11349 | tonnes | 1988 | | Landed Volume | 7523 | tonnes | 1989 | | Landed Volume | 5642 | tonnes | 1990 | | Landed Volume | 6658 | tonnes | 1991 | | Landed Volume | 6005 | tonnes | 1992 | | Landed Volume | 6872 | tonnes | 1993 | | Landed Volume | 5901 | tonnes | 1994 | | Landed Volume | 6078 | tonnes | 1995 | | Landed Volume | 7158 | tonnes | 1996 | | Landed Volume | 6290 | tonnes | 1997 | | Landed Volume | 4627 | tonnes | 1998 | | Landed Volume | 4613 | tonnes | 1999 | | Landed Volume | 3011 | tonnes | 2000 | | Landed Volume | 2439 | tonnes | 2001 | | Landed Volume | 1767 | tonnes | 2002 | | Landed Volume | 1355 | tonnes | 2003 | | Landed Volume | 811 | tonnes | 2004 | | Landed Volume | 341 | tonnes | 2005 | | Landed Volume | 380 | tonnes | 2006 | | Landed Volume | 427 | tonnes | 2007 | | Landed Volume | 445 | tonnes | 2008 | | Landed Volume | 488 | tonnes | 2009 | | Landed Volume | 307 | tonnes | 2010 | | Landed Volume | 230 | tonnes | 2011 | | Landed Volume | 313 | tonnes | 2012 | | Landed Volume | 222 | tonnes | 2013 | | Landed Volume | 184 | tonnes | 2014 | | Landed Volume | 227 | tonnes | 2015 |
Fishery Indicators | Type | Measure | Value | Unit | Time period |
|---|
| Production | Catch | 14325 | tonnes | 1981 | | Catch | 19366 | tonnes | 1982 | | Catch | 22257 | tonnes | 1983 | | Catch | 20476 | tonnes | 1984 | | Catch | 17719 | tonnes | 1985 | | Catch | 11127 | tonnes | 1986 | | Catch | 23460 | tonnes | 1987 | | Catch | 19481 | tonnes | 1988 | | Catch | 13399 | tonnes | 1989 | | Catch | 10172 | tonnes | 1990 | | Catch | 11541 | tonnes | 1991 | | Catch | 15253 | tonnes | 1992 | | Catch | 11631 | tonnes | 1993 | | Catch | 9356 | tonnes | 1994 | | Catch | 11849 | tonnes | 1995 | | Catch | 15098 | tonnes | 1996 | | Catch | 11542 | tonnes | 1997 | | Catch | 13843 | tonnes | 1998 | | Catch | 8588 | tonnes | 1999 | | Catch | 16296 | tonnes | 2000 | | Catch | 6702 | tonnes | 2001 | | Catch | 4618 | tonnes | 2002 | | Catch | 2074 | tonnes | 2003 | | Catch | 2970 | tonnes | 2004 | | Catch | 970 | tonnes | 2005 | | Catch | 1327 | tonnes | 2006 | | Catch | 745 | tonnes | 2007 | | Catch | 759 | tonnes | 2008 | | Catch | 908 | tonnes | 2009 | | Catch | 1200 | tonnes | 2010 | | Catch | 569 | tonnes | 2011 | | Catch | 1039 | tonnes | 2012 | | Catch | 1173 | tonnes | 2013 | | Catch | 767 | tonnes | 2014 | | Catch | 1063 | tonnes | 2015 |
Management Management unit: Yes Sources ICES Advice accessed through ICES Stock Assessment Database on May 2018. ICES, Copenhagen.  http://standardgraphs.ices.dk/ViewCharts.aspx?key=7552 http://standardgraphs.ices.dk/ViewCharts.aspx?key=7552 |
|
| |
|