Aq Res State Trend
| Spawning biomass in relation to precautionary limits | Fishing mortality in relation to precautionary limits | Fishing mortality in relation to high long-term yield | Fishing mortality in relation to agreed target | Comment |
| Undefined | Undefined | Overfished | NA | |
In the absence of agreed reference points, the state of the stock cannot be evaluated. SSB has been stable in recent years but is expected to decline rapidly due to poor recruitment. Fishing mortality has been stable and is estimated at 0.37, well above the candidate for F
msy. From 2004 onwards, recruitment has been declining and is now at a record-low.
Habitat Bio
Depth Zone: Shelf (50 m - 200 m). Vertical Dist: Pelagic.
Geo Dist
Geo Dist: Shared between nations
Exploit
Factors affecting the fisheries and the stockRegulations and their effectsCorrections for misreporting by area have been incorporated in the assessment. In recent years, ICES has calculated that a substantial part of the catch reported as taken in Division IIIa by fleet C was actually taken in Subarea IV. These catches have been allocated to the North Sea stock and accounted for under the A fleet. Regulations allowing quota transfers from Division IIIa to the North Sea were introduced as an incentive to decrease misreporting for the Norwegian part of the fishery. Recent Working Group estimates of 30% misreporting in Division IIIa may be underestimating the problem because not all countries supply this information to ICES.
The quota for the C fleet and the bycatch quota for the D fleet (see above) are set for the NSAS and the WBSS stocks together. The implication for the catch of NSAS must also be taken into account when setting quotas for the fleets that exploit these stocks.
Changes in fishing technology and fishing patternsThere have been only minor changes in the fishery technology in recent years.
Impact of the environment on the fish stockHerring in Division IIIa and Subdivisions 22–24 are migratory. There are feeding migrations from the Western Baltic into more saline waters of Division IIIa and the eastern parts of Division IVa. There are indications from parasite infections that yet unknown proportions of sub-stocks spawning at the southern coast in the Baltic proper may perform similar migrations.
Western Baltic herring recruitment has been reduced by 15–35% annually from 2004 onwards and is now at a record low. North Sea herring, with which Western Baltic herring shares the same environment at least for part of the year, has also produced only very small year classes since 2002. In a recent recruitment analysis for different Baltic herring stocks, the Baltic Sea Index (BSI) reflecting Sea Surface Temperature (SST) was the main predictor for Western Baltic herring (Cardinale
et al., in press). There are no indications of systematic changes in growth or age at maturity, and candidate key stages for reduced recruitment are probably the egg or the larval stage. The specific reasons for reduced egg or larval survival are not known. Further investigation of the causes of the poor recruitment will require targeted research projects.
Bio Assess
Assess Models
Methodology
Scientific basisData and methodsThe otolith microstructure method has been used to calculate the proportion of spring and autumn spawners caught in these areas for all catch and survey data in the period 1991–2008. An analytical FLICA assessment is based on catch data and the results of two acoustic and one larval survey.
Information from the fishing industryVMS data confirm that area misreporting from the North Sea to the Skagerrak has declined in proportion with the reduction in reported landings. Identified misreported catch has been moved to the appropriate areas and are thus taken into account in the assessment.
Uncertainties in assessment and forecastThere is no firm basis to predict the fraction of NSAS in the catches by the C- and D-fleets. The proportions of the two stocks as well as the distribution pattern of the fishery in the Eastern North Sea and in Division IIIa changes dynamically year by year. This is probably influenced by the year class strength of the two stocks and their relative geographical distributions, as well as by fleet behavior reacting to herring availability and management decisions.
The strength of a year class is not firmly estimated before the year class has been followed for 2–3 years. However, the introduction of a larval 0-group recruitment index (N20) in 2008 appears to contribute valuable and consistent information to the estimate of the 1-winter ringers in the assessment.
Comparison with previous assessment and adviceA benchmark assessment was carried out in 2008. The update assessment this year shows a reduction of 23% of the estimated fishing mortality in 2007 and a 21% increase for the SSB in 2007. However trends in recruitment and SSB are similar.
In 2008 ICES advised an immediate reduction in F to candidate for F
msy = 0.25. In the light of the continuing reduction of recruitment, the basis for the advice did not change.
Results
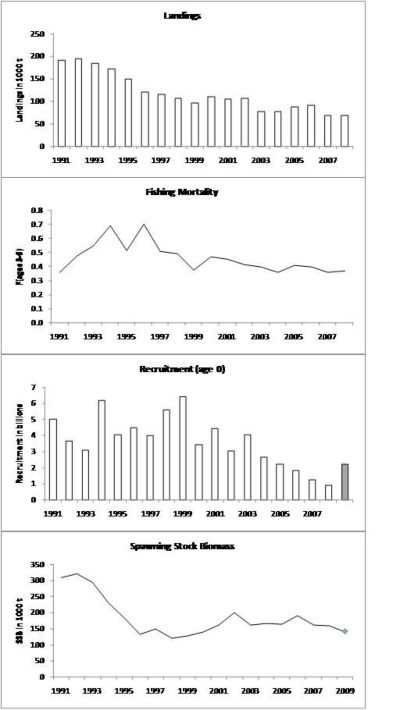 |
Figure 6.4.15.1. Herring in Subdivisions 22–24 and Division IIIa (spring spawners). Landings, fishing mortality, recruitment, and SSB. Estimates are shown in grey. 2009 recruitment taken as GM 2003–2007.  |
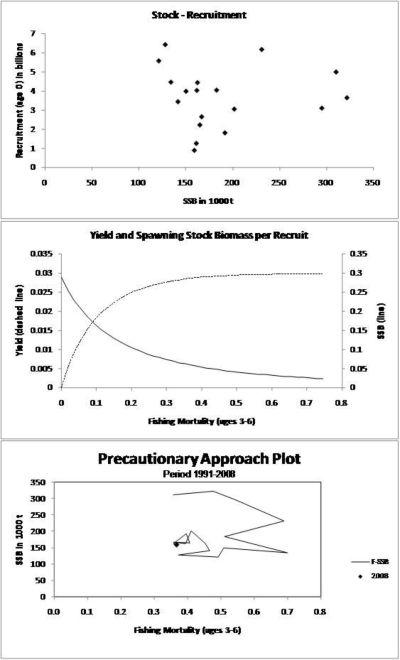 |
| Figure 6.4.15.2. Herring in Subdivisions 22–24 and Division IIIa (spring spawners). Stock recruitment, yield and SSB per recruit, precautionary approach. |
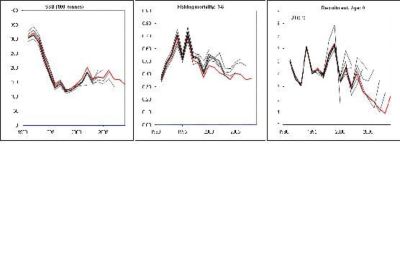 |
| Figure 6.4.15.3. Herring in Subdivisions 22–24 and Division IIIa (spring spawners). Historical performance of the assessment. The last data point for SSB is a prediction, for Recruitment the last data points is GM 03-07. |
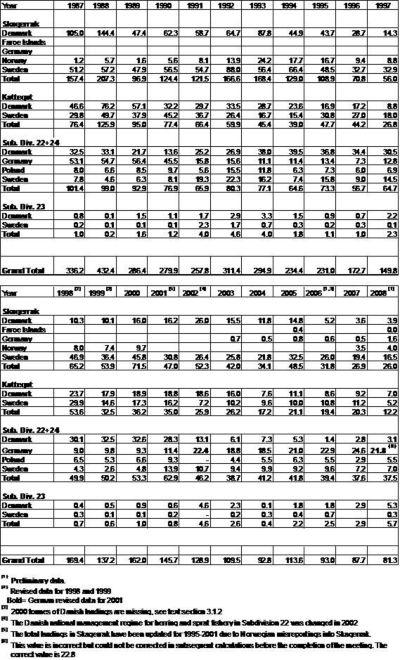 |
| Table 6.4.15.2. Herring in Subdivisions 22–24 and Division IIIa (spring and autumn spawners). Landings (‘000 t). |
Table 6.4.15.3. Herring in Subdivisions 22–24 and Division IIIa (spring spawners). Summary of the assessment.
| Year | Recruitment | SSB | Landings | Mean F |
| | Age 0 | at spawning time | | Ages 3-6 |
| | thousands | tonnes | tonnes | |
| 1991 | 5003979 | 310543 | 191573 | 0.3576 |
| 1992 | 3652584 | 322123 | 194411 | 0.4762 |
| 1993 | 3109372 | 295303 | 185010 | 0.5439 |
| 1994 | 6182874 | 231273 | 172438 | 0.6894 |
| 1995 | 4050991 | 183178 | 150831 | 0.5121 |
| 1996 | 4472243 | 134412 | 121266 | 0.7007 |
| 1997 | 3991042 | 150554 | 115588 | 0.5097 |
| 1998 | 5585578 | 121510 | 107032 | 0.4919 |
| 1999 | 6439794 | 128418 | 97240 | 0.3730 |
| 2000 | 3444329 | 141946 | 109914 | 0.4661 |
| 2001 | 4448602 | 162715 | 105803 | 0.4537 |
| 2002 | 3057143 | 201961 | 106191 | 0.4102 |
| 2003 | 4039490 | 162065 | 78309 | 0.3944 |
| 2004 | 2655128 | 167171 | 76815 | 0.3577 |
| 2005 | 2226088 | 165281 | 88406 | 0.4073 |
| 2006 | 1813432 | 192109 | 90549 | 0.3959 |
| 2007 | 1259682 | 161537 | 68997 | 0.3576 |
| 2008 | 894443 | 159406 | 68484 | 0.3670 |
| 2009* | 2225068 | 141824 | | |
| Average | 3607756 | 185965 | 118270 | 0.4591 |
| * Recruitment is GM (2003–2007). SSB is predicted. |
Ref Point
There are no precautionary approach reference points agreed for this stock.
Yield and spawning biomass per Recruit F-reference points (2009): | | Fish Mort | Yield/R | SSB/R |
| | Ages 3-6 | | |
| Average last 3 years | 0.37 | 0.03 | 0.06 |
| Fmax* | - | - | - |
| F0.1 | 0.23 | 0.03 | 0.09 |
| Fmed | 0.39 | 0.03 | 0.05 |
| *Fmax is not well defined. |
Candidates for reference points consistent with high long-term yields and a low risk of depleting the productive potential of the stock are around
F0.1. Preliminary HCR evaluations are consistent with this view and have shown that candidates for F
msy can be found in the region of F = 0.25 (see Section 8.3.3.1).
Projection
Outlook for 2010 To derive the total herring catch for Division IIIa (right hand side of the table), predicted catches of NSAS (as advised in Section 6.4.16) have to be added to the advised maximum catches of WBSS in the area. The total catch by fleet is only compatible with the advice for WBSS if the values given for NSAS are treated as maximum catches. Thus the resulting catch options were also used as constraints for catch options for the NSAS herring (Section 6.4.16). Note that the right hand side of the table is for illustrative purposes only and is not part of the ICES advice; the ratio of TACs between areas is not fixed and there are several options for TACs compatible with the removal of WBSS advised by ICES.
Explanation on fleet coding: | Area | Fleet | Description |
| North Sea | A | Directed herring fisheries with purse-seiners and trawlers. Bycatches in industrial fisheries by Norway are included. |
| | B | Bycatches of herring taken under EU regulations. |
| Division IIIa | C | Directed herring fisheries with purse-seiners and trawlers. |
| | D | Bycatches of herring caught in the small-mesh fisheries. |
| Subdivisions 22-24 | F | All herring fisheries in Subdivisions 22–24. |
Catch options for mixed stocks in Division IIIa based on short-term predictions for Western Baltic Spring-Spawning herring (WBSS)Catch options for the whole stock of Western Baltic Spring-Spawning herring (WBSS) can be partitioned into catches by area. Catches of WBSS herring in Division IIIa also imply catches of North Sea Autumn-Spawning (NSAS) herring which constitute part of the total catch in that area.
ICES catch predictions versus management TACICES advises on catch options by fleet for the entire distribution of the two herring stocks separately, whereas herring is managed by areas cross-sectioning the geographical distribution of the stocks (see the following text diagram).
The catch options for 2010 are based on the TAC proportions by fleet and area in 2009 and, for IIIa, on the observed stock composition (WBSS vs. NSAS) in catches taken in 2008. Short-term predictions are based on an expected catch in 2009 of 45 087 t of Western Baltic spring spawning stock taking into account the TACs by fleet for 2009, potential misreporting and the assumed proportion of Western Baltic spring spawning herring in the catches in Division IIIa.
To make fleet wise catch options for the prediction year it is assumed that the TAC distribution by fleet in 2010 will be equal to 2009. It is also assumed that there will be allowed a subtraction of 20% of the Norwegian quota that is transferred to the A-fleet (as NSAS). Further it is assumed that each fleet catches its total TAC. Finally it is assumed that the 2008 proportions of WBSS by fleet hold for 2010. The proportions of WBSS in catches were 0.71 in the C-fleet, 0.37 in the D-fleet and 1.00 in the F-fleet and further a constant catch of 120 t of WBSS caught in the A-fleet in Division IVa East.
Sci Advice
Single-stock exploitation boundariesICES advises on the basis of exploitation boundaries in relation to long-term yield that fishing at the candidate Fmsy fishing mortality (0.25) implies catches in 2010 not larger than 39 800 t in the entire distribution area. Table 6.4.15.1. Herring in Division IIIa and Subdivisions 22–24 (Western Baltic spring spawners). Single stock exploitation boundaries (advice), management and catches.
| Year | ICES
Advice | Pred. catch
corresp.
to advice | Agreed
TAC IIIa2 | ICES catch of
Stock |
| | | | | 22–24 | IIIa | IV | Total |
| 1987 | Reduction in F | 224 | 218 | 102 | 59 | 14 | 175 |
| 1988 | No increase in F | 196 | 218 | 99 | 129 | 23 | 251 |
| 1989 | TAC | 174 | 218 | 95 | 71 | 20 | 186 |
| 1990 | TAC | 131 | 185 | 78 | 118 | 8 | 204 |
| 1991 | TAC | 180 | 155 | 70 | 112 | 10 | 192 |
| 1992 | TAC | 180 | 174 | 85 | 101 | 9 | 195 |
| 1993 | Increased yield from reduction in F; reduction in juvenile catches | 188 | 210 | 81 | 95 | 10 | 186 |
| 1994 | TAC | 130–180 | 191 | 66 | 92 | 14 | 172 |
| 1995 | If required, TAC not exceeding recent catches | 168–192 | 183 | 74 | 80 | 10 | 164 |
| 1996 | If required, TAC not exceeding recent catches | 164–171 | 163 | 58 | 71 | 1 | 130 |
| 1997 | IIIa: managed together with autumn spawners
22–24: if required, TAC not exceeding recent catches | 66–851 | 100 | 68 | 55 | 1 | 124 |
| 1998 | Should be managed in accordance with North Sea autumn spawners | - | 97 | 51 | 53 | 8 | 112 |
| 1999 | IIIa: managed together with autumn spawners
22–24: if required, TAC not exceeding recent catches | - | 99 | 50 | 43 | 5 | 98 |
| 2000 | IIIa: managed together with autumn spawners
22–24: if required, TAC not exceeding recent catches | ~60 for Subdivs. 22–24 | 101 | 54 | 57 | 7 | 118 |
| 2001 | IIIa: managed together with autumn spawners
22–24: if required, TAC not exceeding recent catches | ~50 for Subdivs. 22–24 | 101 | 64 | 42 | 6 | 112 |
| 2002 | IIIa: managed together with autumn spawners
22–24: if required, TAC not exceeding recent catches | ~50 for Subdivs. 22–24 | 101 | 53 | 47 | 7 | 107 |
| 2003 | Reduce F | <80 | 101 | 40 | 36 | 2 | 78 |
| 2004 | Separate management regime for this stockReduce F | <92 | 91 | 42 | 24 | 7 | 77 |
| 2005 | Separate management regime for this stockStatus quo F | 95 | 120 | 44 | 38 | 7 | 89 |
| 2006 | Separate management regime for this stockStatus quo F | 95 | 1023/47.5* | 42 | 36 | 11 | 89 |
| 2007 | Separate management regime for this stockStatus quo F | 99 | 693/49.5* | 40 | 28 | 1 | 68 |
| 2008 | Separate management regime for this stockReduce F by 20% towards F 0.1 | 71 | 51.73/45* | 43 | 25 | 0 | 68 |
| 2009 | Separate management regime for this stockReduce F to F = 0.25 | < 32.8 | 37.73/27.2* | | | | |
| 2010 | Separate management regime for this stockReduce F to F = 0.25 | <39.8 | | | | | |
| Weights in ‘000 t.1Catch in Subdivisions 22–24.2Including mixed clupeoid TAC and bycatch ceiling in small-mesh fishery.3 Human consumption in Division IIIa, not incuding industrial bycatch or mixed clupeoids, but including North Sea Autumn Spawner catch in fleet C.* separate TAC for SD 22–24. |
Management
Management unit: Yes
Objectives
There are no explicit management objectives for this stock.
Advice
Management considerationsNorth Sea Autumn-Spawning and the Western Baltic Spring-Spawning herring stocks are exploited and managed simultaneously in Division IIIa. Hence, the management of the herring fisheries in Division IIIa influences both stocks.
Recruitment of Western Baltic herring has been reduced by 15–35% annually from 2004 onwards. The estimated strength of the 2008 year class is the lowest of the whole times series, and amounts to only a quarter of the average. There is no indication that recruitment would return to the previous level in the near future. The poor year classes have not yet fully contributed to the SSB but will increasingly do so in the near future. In this situation, there is no alternative to reduce F significantly to avoid a drastic decline of the SSB.
ICES has used the mean recruitment from 2003–2007 (year classes) for the short-term prediction which might be overly optimistic in the present situation.
Sources
ICES. 2009. Report of the ICES Advisory Committee, 2009. ICES Advice, 2009.