White marlin Atlantic|
| Fact Sheet Title Fact Sheet |
| | | | Data Ownership | | This document owned by International Commission for the Conservation of Atlantic Tunas (ICCAT), provided and maintained by Standing Committee on Research and Statistics , is part of ICCAT SCRS Reports data collection. |
| | ident Block | ident Block | | | | Species List: | | Species Ref: en - Atlantic white marlin, fr - Makaire blanc de l'Atlantique, es - Aguja blanca del Atlántico, ru - Копьеносец белый (=марлин белый) |
|
|
| ident Block White marlin Atlantic Map tips - Click on
 to turn layers on and off to turn layers on and off - Double-click to zoom in
- Drag to pan
- Hold down the shift key and drag to zoom to a particular region
|
|
|
|
| | Aq Res | Biological Stock: Yes Value: Regional
Management unit: Yes Reference year: 2010
|
| Considered a management unit: An aquatic resource or fishery is declared as [Fishery] Management Unit if it is effectively the focus for the application of selected management methods and measures, within the broader framework of a management system. According to the FAO Glossary for Responsible Fishing, "a Fishery Management Unit (FMU) is a fishery or a portion of a fishery identified in a Fishery Management Plan (FMP) relevant to the FMP's management objectives." FMU's may be organised around fisheries biological, geographic, economic, technical, social or ecological dimensions , and the makeup and attribute of a fishery management unit depends mainly on the FMP's management objectives. |
| Jurisdictional distribution: Jurisdictional qualifier (e.g. "shared", "shared - highly migratory") of the aquatic resource related with its spatial distribution. |
| Environmental group: Classification of the aquatic resource according to the environmental group (e.g. pelagic invertebrate, or demersal fish) to which the species belong. |
| Reference Year: The Reference Year is the last year considered in the stock assessment and/or fishery status. |
| | | | | | History The most recent assessment for white marlin was conducted in 2012 through a process that included a data preparatory meeting in April 2011 (Anon. 2012a) and an assessment meeting held in May 2012 (Report of the 2012 White Marlin Stock Assessment Meeting, SCRS/2012/012). The last year of fishery data used in the assessment was 2010. Habitat Bio Climatic Zone: Temperate. Horizontal Dist: Oceanic. Vertical Dist: Pelagic. White marlin spawning areas occur mainly in the tropical western North and South Atlantic, predominantly in the same offshore locations in their normal range. In the North Atlantic, spawning activity has been reported off eastern Florida (USA), the Windward Passage (between La Hispaniola and Cuba), and north of Puerto Rico. Seasonal spawning concentrations have been noted northeast of Hispaniola and Puerto Rico, and off the east coast of Hispaniola. Spawning activity has also been reported for the equatorial Atlantic (5°N-5°S) off northeastern Brazil, and in the South Atlantic off southern Brazil. Previous reports have mentioned that spawning takes place during austral and boreal spring-summer. In the North Atlantic, reproduction events occur from April to July, with spawning activity peaking around April-May. In the equatorial Atlantic (5°N-5°S), spawning occurs during May-June, and in the South Atlantic, reproduction events take place from December to March. White marlin inhabits the surface mixed layer of the open ocean. Although they spend most of their time in the warm waters of the epipelagic zone, they do not confine themselves to a narrow range of temperatures but are known to explore temperatures ranging 7.8-29.6 °C. Information from pop-up satellite archival tag (PSAT) data indicated frequent short-duration dives extending to >300 m depths, although most dives ranged from 100 to 200 m. Two types of diving behavior have been identified for white marlin, (1) a shorter duration V-shaped dive, and (2) a U-shaped dive characterized as those confined to a specific depth range for a prolonged period. These patterns, however, can be highly variable between individuals and also vary depending on the temperature and dissolved oxygen of the surface mixed layer. Therefore, it is important to consider vertical habitat use and the environmental factors that influence it during the standardization of CPUE data. All white marlin biological material sampled prior to the confirmation of the presence of roundscale spearfish (T. georgii) in 2006, are now presumed to contain an unknown proportion of roundscale spearfish. Therefore reproductive parameters, growth curves and other biological studies previously thought to describe white marlin may not accurately represent this species. 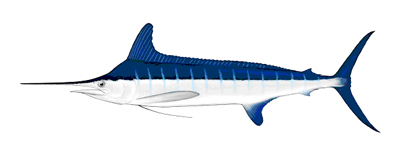 | White marlin. Source: ICCAT.  |
Geo Dist Geo Dist: Highly migratory White marlin are distributed widely in the Atlantic Ocean, in coastal and offshore areas, mostly ranging from 45ºN to 45ºS. Water Area Overview  | | Water Area Overview White marlin Atlantic
| iccat Smu | WHM_ATL: Atlantic |
| | | | | | Water Area Overview |
Water Area OverviewWhite marlin Atlantic Aq Res Struct Biological Stock: Yes For management purposes the SCRS adopted a total Atlantic stock based on previous assessment conclusions and genetic data. However, available information is not conclusive and further research are needed. Exploit Fishery Indicators It has now been confirmed that white marlin landings reported to ICCAT include roundscale spearfish in significant numbers, so that historical statistics of white marlin most likely comprise a mixture of the two species. Studies of white marlin/roundscale spearfish ratios in the western Atlantic have been conducted, with overall estimated ratios between 23-27%, although they varied in time and space. Previously, these were thought to represent only white marlin. However, there is little information on these species ratios in the eastern Atlantic. The decadal geographic distribution of the catches is given in Figure 1. The Committee used Task I catches as the basis for the estimation of total removals (Figure 2). Total removals for the period 1990-2010 were obtained during the 2012 White Marlin Stock Assessment Session by modifying Task I values with the addition of white marlin that the Committee estimated from catches reported as billfish unclassified. Additionally the reporting gaps for some fleets were completed using estimates based on catch values reported for years before and/or after the gap(s) years. Task I catches of white marlin in 2010 and 2011 were 431 t and 346 t, respectively ( Table 1. ). Task I catches of white marlin for 2011 are to be considered preliminary. Due to the work conducted by the Committee and improved reporting by CPCs the amount of unclassified billfish in the Task I table has been minimized. A series of indices of abundance for white marlin were presented and discussed during the 2011 and 2012 meetings. Following the guidelines developed by the SCRS Working Group on Stock Assessment Methods (WGSAM), seven CPUE series were selected for their inclusion in the assessment models. In general, the indices showed no discerning trend during the latter part of the time series examined (Figure 3). During the 2012 assessment, an estimated standardized combined CPUE index for white marlin showed a sharp decline during the period 1960-1991, and a relatively stable trend thereafter (Figure 3). 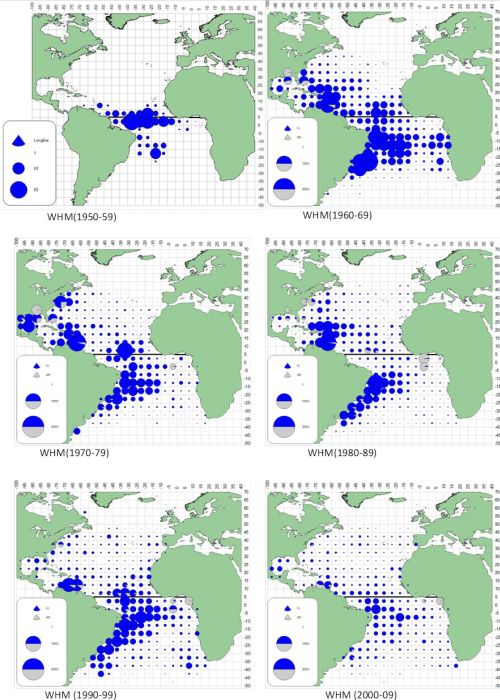 | | Figure 1. Geographic distribution of mean white marlin catch by major gears and decade. |
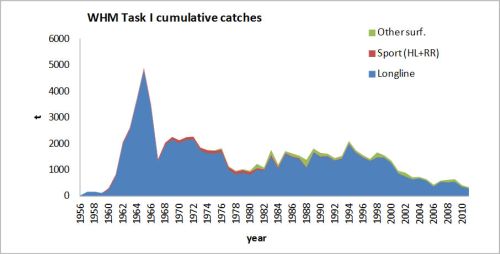 | | Figure 2. Total catch of white marlin reported in Task I for the period 1956-2011. |
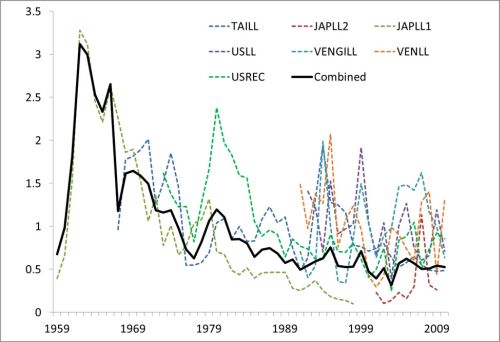 | | Figure 3. White marlin indices of abundance presented and selected during the meeting. For graphing purposes the indices were scaled to their respective mean value for the period 1990-2010. |
Bio Assess Assess Models Assess Model Entry Results Unlike the partial assessment conducted in 2006, the Committee conducted a full assessment in 2012, which included estimations of management benchmarks. Two models were used to estimate the status of the stock, a surplus production model (ASPIC), and a fully integrated model (SS3). The methods used for the fully integrated model followed very closely to those used in the 2011 blue marlin assessment. As recommended by the Committee in 2010, the model configuration was an effort to use all available data on white marlin, including lengths, dimorphic growth patterns and other biological data. Although it is believed that the modeling methods employed were relatively robust, the input data for the models were very likely less so. Perhaps the most important uncertainty was that associated with the landings data. There remains uncertainty not only in the species composition but also the magnitude of the catch. This is especially a problem with the landings data starting in 2002 when CPCs were mandated to release billfish that were alive at haulback. This lead to a decrease in reported landings but not necessarily a decrease in fishing and/or release mortality. This apparent drop in landings lead to a marked decrease in the estimates of F/F MSY from 2002-present, however the Committee considers that this trend is likely overly optimistic due to unreported catch and unaccounted release mortality. The results of the 2012 assessment indicated that the stock remains overfished but most likely not undergoing overfishing (Figures 4-5). Relative fishing mortality has been declining over the last ten years and is now most likely to be below F MSY (Figure 6). Relative biomass has probably stopped declining over the last ten years, but still remains well below B MSY (Figure 6). There is considerable uncertainty in these results. The two assessment models provide different estimates about the productivity of the stock, with the integrated model suggesting that white marlin is a stock that can rebuild relatively fast whereas the surplus production model suggests the stock will rebuild very slowly. The results from both approaches are considered to be equally plausible. These results are conditional on the reported catch being a true reflection of the fishing mortality experienced by white marlin. Sensitivity analyses suggest that if recent fishing mortality has been greater than reported, because discards are not reported by many fleets, estimates of stock status would be more pessimistic and current relative biomass would be lower and overfishing would continue. The presence of unknown quantities of roundscale spearfish in the reported catches and data used to estimate relative abundance of white marlin increases the uncertainty for the stock status and outlook for this species. 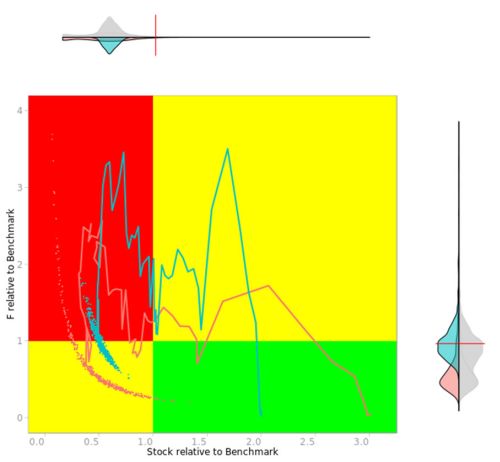 | | Figure 4. Kobe phase plot panel showing the estimated trajectories for stock (B) relative to BMSY and harvest rate (F) relative to FMSY (line) along with the bootstrap estimates for 2012. The green quadrant corresponds to the stock not being overfished and no overfishing occurring and the red quadrant to the stock being overfished and overfishing occurring. The red line represents the SS3 model, and the blue line represents the ASPIC model (large panel). The marginal densities plots for stock relative to BMSY and harvest rate relative to FMSY are also shown (top and right of large panel); the upper part (grey) are combined probabilities for both ASPIC and SS3, and the lower part (blue and pink) are individual probabilities of ASPIC and SS3 overlaid. The red lines represent the benchmark levels (ratios equal to 1.0). |
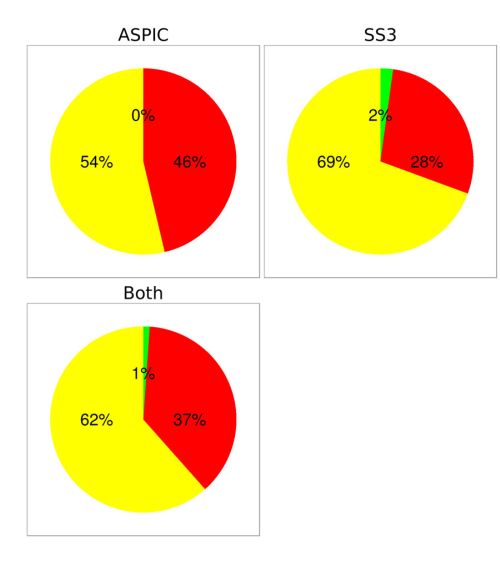 | | Figure 5. Pie chart showing the proportion of assessment results for 2012 that are within the green quadrant of the Kobe plot chart (not overfished, no overfishing), the yellow quadrant (overfished or overfishing), and the red quadrant (overfished and overfishing). |
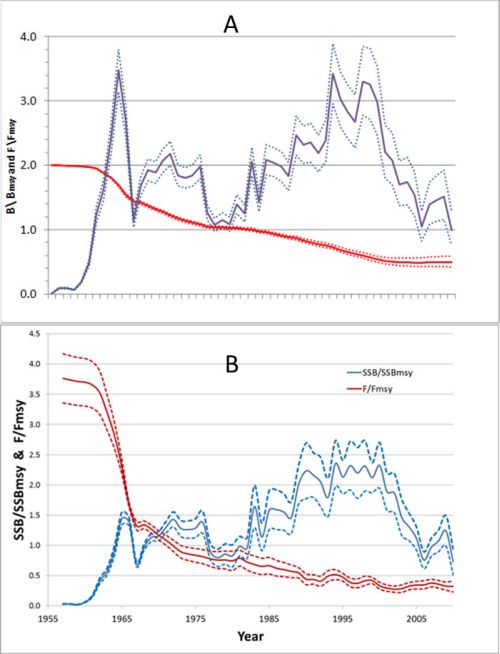 | | Figure 6. Historical ASPIC (A) and SS3 (B) estimates of biomass over biomass at MSY ratio (red) and fishing mortality over fishing mortality at MSY ratios (blue) for white marlin. |
Results Projection Recovery/Outlook The outlook for this stock remains uncertain because of the possibility that reported catches underestimate fishing mortality and the lack of certainty in the productivity of the stock. As a result forecasts of how the stock will respond to different levels of catch are uncertain (Figure 7). At current catch levels of about 400 t the stock will likely increase in size, but is very unlikely to rebuild to B MSY in the next ten year period (Figure 7). Fishing mortality is highly likely to remain below F MSY. The speed at which the stock biomass may increase and the time necessary to rebuild the stock to B MSY remains highly uncertain. This will depend on whether current reported catches are true estimates of fishing mortality, and on the true productivity of the white marlin stock. 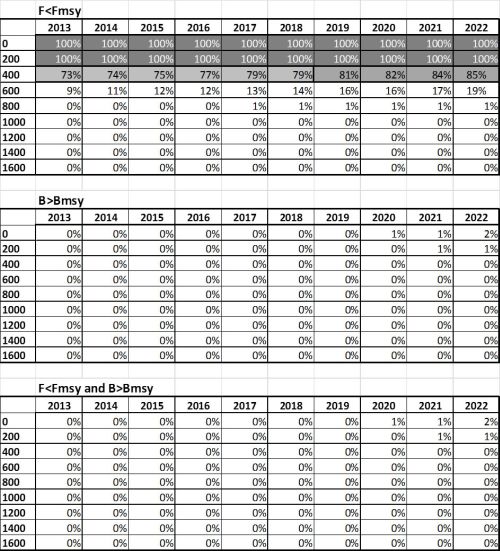 | | Figure 7. Kobe II Strategy Matrix (K2SM) of the combined models (ASPIC and SS3). Percent values indicate the probability of achieving the goal of F<FMSY, B>BMSY, and SSByr >= SSBMSY and Fyr < FMSY for each year (yr) under different constant catch scenarios (TAC tons). |
Management Management unit: Yes Effects of current regulations Recommendations [Rec. 00-13], [Rec. 01-10] and [Rec. 02-13] placed additional catch restrictions on white marlin. Recommendation [02-13] established that the annual amount of white marlin that can be harvested by pelagic longline and purse seine vessels and retained for landing must be no more than 33% with respect to 1996. It also established that all white marlin brought to pelagic longline and purse seine vessels alive shall be released in a manner that maximizes their survival. This provision does not apply to marlins that are dead when brought alongside the vessel and that are not sold or entered into commerce. The Committee estimated the catch of pelagic longline vessels for a subset of fleets that they thought would be affected by Recommendations [Rec. 00-13] and [Rec. 02-13]. Catches from these fleets represent 93% of all longline caught white marlin during the period 1990-2007. Catches of white marlin have declined since 1996-99, the period selected as the reference period by the recommendations. Since 2002, the year of implementation of [Rec. 01-10] and [Rec. 02-13], the catch of white marlin has been at about the 33% value recommended by the Commission. This analysis represents only longline caught marlin even though the recommendations referred to the combined catch of pelagic longline and purse seine, because the catch estimates of billfish bycatch from purse seine vessels are more uncertain than those from longline. Over the period considered, purse seine caught marlin represent 2% of the total catch reported by the combination of purse seine and pelagic longline. The Committee notes that the management plan developed by the Commission was based on the fact that at that time most white marlin catches originated from industrial fisheries. Since then, the Committee noted a significant increase in the contribution from non-industrial fisheries to the total of white marlin harvest and that these fisheries are not fully accounted for in the current management plan. The Committee noted that more countries have started reporting data on live releases in 2006. However there is not enough information on the proportion of fish being released alive to evaluate the effectiveness of the ICCAT recommendation, relating to the live release of white marlin. Advice Further reductions in fishing mortality are likely to speed up the rebuilding of the stock. Unfortunately, the inability to accurately estimate fishing mortality will continue to compromise our ability to monitor the stock’s recovery period. This is due to the inadequate reporting of discards, as well as the lack of reports from some artisanal and recreational fisheries that take marlin species. It is therefore recommended that measures taken to ensure that monitoring and reporting of discards, including live releases, are appropriate and accurate. Only when the true magnitude of current fishing mortality is estimated can the level of catch required to rebuild the stock be precisely estimated. Until then the Commission, at the minimum, should ensure catches do not exceed current levels. One approach to reduce fishing mortality could be the use of non-offset circle hooks as terminal gear. Recent research has demonstrated that in some longline fisheries the use of non-offset circle hooks resulted in a reduction of marlin mortality, while the catch rates of several of the target species remained the same or were greater than the catch rates observed with the use of conventional J hooks or offset circle hooks. The Committee considers that this approach may be more efficient and enforceable than time-area closures and, thus, it recommends that the Commission considers this alternative approach. Currently, three ICCAT Contracting Parties (Brazil, Canada, and the United States) already mandate or encourage the use of circle hooks on their pelagic longline fleets. In addition, reducing fishing mortality of white marlin from non-industrial fisheries should be considered. ATLANTIC WHITE MARLIN SUMMARY | MSY Current (2011) Yield Relative Biomass:
B2010/BMSY
SSB2010/SSBMSY | 874 t 1 - 1604 t 2 344 t 3
0.50 (0.42-0.60)4
0.322 (0.23-0.41)5
| | | | Relative Fishing Mortality:
F2010/FMSY | 0.99 (0.75-1.27)4
0.72 (0.51-0.93)5 | | | Catchrecent6/Catch1996 Longline and Purse seine | 0.36 | Overfished Overfishing | Yes Not likely7 | Conservation and Management
Measure in Effect: | Recommendation [Rec. 06-09].
The annual amount of white marlin that can be harvested by pelagic longline and purse seine vessels and retained for landing must be no more than 33% for white marlin of the 1996 or 1999 landing levels, whichever is greater. | 1ASPIC estimates.
2SS3 estimates.
32011 yield should be considered provisional, 2010 yield was 431 t.
4ASPIC estimates with 10 and 90 percentiles.
5SS3 estimates with approximate 95% confidence intervals.
6Catch recent is the average annual longline and purse seine catch for 2008-2010.
7Overfishing could be occurring if catches are under reported.
Sources “Report of the 2012 Meeting of the Standing Committee on Research and Statistics.” International Commission for the Conservation of Atlantic Tunas (ICCAT). 2013 ICCAT Report for biennial period, 2012-13 PART I (2012) - Vol. 2 ICCAT  http://www.iccat.int/Documents/BienRep/REP_EN_12-13_I_2.pdf http://www.iccat.int/Documents/BienRep/REP_EN_12-13_I_2.pdf |
|
| |
|
|


