Swordfish - North Atlantic|
| Fact Sheet Title Fact Sheet |
| | | Swordfish - North Atlantic |
 | Swordfish in the North Atlantic |
| | Data Ownership | | This document owned by International Commission for the Conservation of Atlantic Tunas (ICCAT), provided and maintained by Standing Committee on Research and Statistics , is part of ICCAT SCRS Reports data collection. |
| | ident Block | ident Block | | | | Species List: | | Species Ref: en - Swordfish, fr - Espadon, es - Pez espada, ru - Меч-рыба |
|
|
| ident Block Swordfish - North Atlantic Map tips - Click on
 to turn layers on and off to turn layers on and off - Double-click to zoom in
- Drag to pan
- Hold down the shift key and drag to zoom to a particular region
| iccat Smu |
|---|
| SWO_N | North Atlantic |
|---|
|
|
|
|
| | Aq Res | Biological Stock: Yes Value: Sub-Regional
Management unit: Yes Reference year: 2015
|
| Considered a management unit: An aquatic resource or fishery is declared as [Fishery] Management Unit if it is effectively the focus for the application of selected management methods and measures, within the broader framework of a management system. According to the FAO Glossary for Responsible Fishing, "a Fishery Management Unit (FMU) is a fishery or a portion of a fishery identified in a Fishery Management Plan (FMP) relevant to the FMP's management objectives." FMU's may be organised around fisheries biological, geographic, economic, technical, social or ecological dimensions , and the makeup and attribute of a fishery management unit depends mainly on the FMP's management objectives. |
| Jurisdictional distribution: Jurisdictional qualifier (e.g. "shared", "shared - highly migratory") of the aquatic resource related with its spatial distribution. |
| Environmental group: Classification of the aquatic resource according to the environmental group (e.g. pelagic invertebrate, or demersal fish) to which the species belong. |
| Reference Year: The Reference Year is the last year considered in the stock assessment and/or fishery status. |
| | | | | | History The status of the North Atlantic swordfish stocks is based on the most recent analyses conducted in July 2017 by means of applying statistical modelling to the available data up to 2015. Complete information on the assessment can be found in the Report of the 2017 ICCAT Atlantic Swordfish Stock Assessment Session. Habitat Bio Climatic Zone: Temperate. Horizontal Dist: Oceanic. Vertical Dist: Pelagic. Swordfish ( Xiphias gladius) are members of the family Xiphiidae and are in the suborder Scombroidei. They can reach a maximum weight in excess of 500 kg. They are distributed widely in the Atlantic Ocean and Mediterranean Sea. In the ICCAT Convention area, the management units of swordfish for assessment purposes are a separate Mediterranean group, and North and South Atlantic groups separated at 5°N. New genetic information was reviewed that indicated that the existing stock boundaries should be refined for the Atlantic and Mediterranean stocks. Swordfish feed on a wide variety of prey including groundfish, pelagic fish, deep-water fish, and invertebrates. They are believed to feed throughout the water column, and from electronic tagging studies, undertake extensive diel vertical migrations. Swordfish mostly spawn in the western warm tropical and subtropical waters throughout the year, although seasonality has been reported in some of these areas. They are found in the colder temperate waters during summer and fall months. Young swordfish grow very rapidly, reaching about 140 cm LJFL (lower-jaw fork length) by age three, but grow slowly thereafter. Females grow faster than males and reach a larger maximum size. Tagging studies have shown that some swordfish can live up to 15 years. Swordfish are difficult to age, but about 50% of females were considered to be mature by age five, at a length of about 180 cm. However, the most recent information indicates a smaller length and age at maturity. The analysis of the horizontal movements evidences seasonal patterns, with fish generally moving south by winter and returning to the temperate foraging grounds in spring. Broader areas of mixing between some eastern and western areas were also suggested. These new results obtained by pop-up satellite tags also fully confirm the previous knowledge that was available from fishery data: deep longline settings catch swordfish during the day-time as a by-catch, while shallow setting longliners target swordfish at night closer to the surface. More information on swordfish biology and ecology is published in the ICCAT Manual. Geo Dist Geo Dist: Highly migratory Swordfish is a temperate tuna widely distributed throughout the Atlantic Ocean and Mediterranean Sea, in coastal and offshore areas, mostly ranging from 50°N to 45°S. Water Area Overview Spatial Scale: Sub-Regional Water Area Overview  | | Water Area Overview Swordfish - North Atlantic
| iccat Smu | SWO_N: North Atlantic |
| | | | | | Water Area Overview |
Water Area OverviewSwordfish - North Atlantic Aq Res Struct Biological Stock: Yes On the basis of the biological information available for assessment purposes, the existence of three stocks is assumed: northern and southern Atlantic stocks (separated at 5ºN) and Mediterranean stock ( Figure 1). 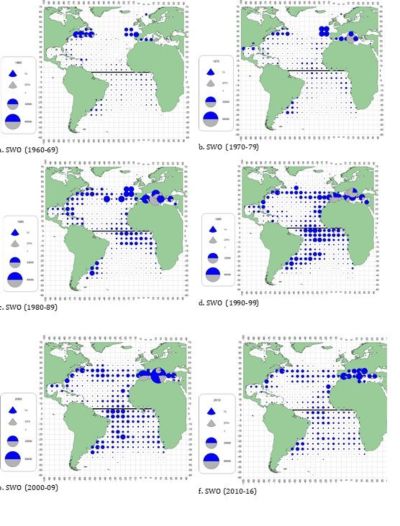 | Figure 1: Geographic distribution of swordfish cumulative catch (t) by gear, in the Convention area, shown on a decadal scale. The maps are scaled to the maximum catch observed during 1960-2016 (the last decade only covers 7 years).  |
Exploit Description of fisheriesNorth AtlanticDue to the broad geographical distribution of Atlantic swordfish ( Figure 1) in coastal and off-shore areas (mostly ranging from 50ºN to 45ºS), this species is available to a large number of fishing countries. Directed longline fisheries from Canada, EU-Spain, and the United States have operated since the late 1950s or early 1960s, and harpoon fisheries have existed at least since the late 1800s. Other directed swordfish fisheries include fleets from Brazil, Morocco, Namibia, EU-Portugal, South Africa, Uruguay, and Venezuela. The primary by-catch or opportunistic fisheries that take swordfish are tuna fleets from Chinese Taipei, Japan, Korea and EU-France. The tuna longline fishery started in 1956 and has operated throughout the Atlantic since then, with substantial catches of swordfish that are produced as a by-catch of tuna fisheries. The largest proportion of the Atlantic catches is made using surface-drifting longline. However, many additional gears are used, including traditional gillnets off the coast of western Africa. The trends in mean fish weight taken in the North Atlantic fisheries are shown in Figure 3. For the past decade, the North Atlantic estimated catch (landings plus dead discards) has averaged about 12,000 t per year ( Table 1 and Figure 2). The catch in 2017 (10,046 t) represents a 50.4% decrease since the 1987 peak in North Atlantic landings (20,238 t). These reduced landings have been attributed to ICCAT regulatory recommendations and shifts in fleet distributions, including the movement of some vessels in certain years to the South Atlantic or out of the Atlantic. In addition, some fleets, including at least the United States, EU-Spain and EU-Portugal have changed operating procedures to opportunistically target tuna and/or sharks, taking advantage of market conditions and higher relative catch rates of these species previously considered as by-catch in some fleets. Recently, socio-economic factors may have also contributed to the decline in catch. Trends by area (NE vs. NW Atlantic) in the CPUE indexes were consistent with the seasonal movement patterns observed in the electronic tagging data, as well as in the catches and sex-ratio distributions. Relationships observed for the eastern Atlantic were opposite to those in the western Atlantic. This pattern was correlated with the decadal cycling of the AMO as well as that of the North Atlantic Oscillation (NAO). Including the AMO as a covariate to area specific catchability within the assessment model helped reduce the conflicting directions of the various CPUE trends. Further analysis and hypothesis testing were recommended to determine if the relationship was due to a swordfish temperature preference, a change in prey distribution, or perhaps both. For the North Atlantic stock some of the indices of abundance were affected by changes in gear technology and management that could not be accounted for in the CPUE standardization, and therefore had to be split. Available catch per unit effort (CPUE) series were evaluated by the Committee and certain indices were identified as suitable for use in the assessment models (Canada, EU-Portugal, EU-Spain, Japan, Morocco, and USA). Trends in standardized CPUE series by fleets contributing to the stock assessment models are shown in Figure 4. Most of the series have an increasing trend since the late 1990s, but show a decrease in the more recent years. There have been some recent changes in United States regulations that may have impacted catch rates. The combined index used as the continuity model from the previous assessment is shown in Figure 5. 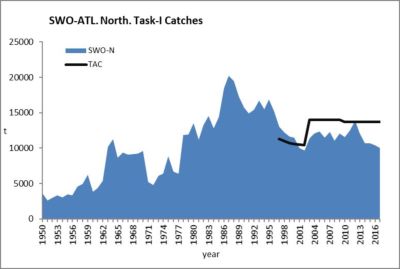 | | Figure 2: Total swordfish catches reported to ICCAT (Task I) for the northern Atlantic stock including TAC. |
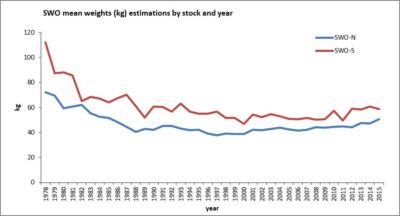 | | Figure 3: Trends in mean weight (kg) for the North and South Atlantic swordfish stocks. |
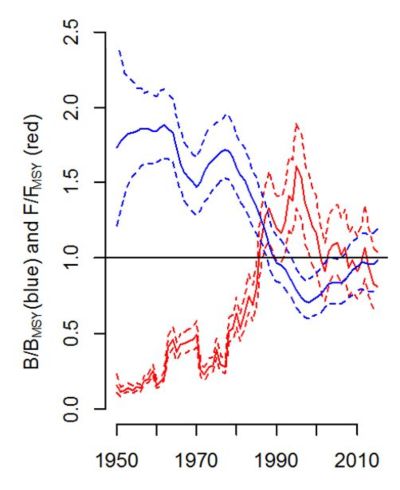
Bio Assess Assess Models In 2017, a stock assessment of the northern Atlantic swordfish was conducted by means of applying statistical modelling to the available data up to 2015. Three stock assessment platforms were used to provide estimates of stock status for the North Atlantic swordfish stock, a surplus production model (ASPIC), a Bayesian surplus production model with process error (BSP2) and an integrated assessment model (Stock Synthesis SS3). Stock status was determined from SS and BSP2 models, while ASPIC was used mainly to provide continuity with the previous assessments. The final base case SS3 model estimated that B 2015 was above B MSY (median = 1.13, 95% CIs = 0.81-1.45) and F 2015 was lower than F MSY (median = 0.75, 95% CIs = 0.57-0.92) ( Figure 6). The final base case BSP2 model estimated that current biomass (B 2015) was near B MSY (median = 0.99, 95% CIs = 0.77-1.24) and current F 2015 was lower than F MSY (median = 0.81, 95% CIs = 0.61-1.10) ( Figure 7). Both models agreed that overfishing is not occurring, and that biomass is either higher or very close to B MSY ( Figure 8). The estimate of stock status in 2017 is slightly more pessimistic than the estimated status in the previous 2009 and 2013 assessments, and suggests that in 2015 there was a 61% probability that the stock is at or above MSY reference levels. The results obtained in this evaluation are not strictly comparable with those obtained in the last assessments due to the incorporation of more data sources, and using joint probabilities from two base case models, and updated catch and CPUE information. The most recent estimates of stock productivity are lower than the previous estimates. Compared with the previous 2009 and 2013 ASPIC base case models, the trajectory of biomass is similar until the late 1990s, thereafter the current model predicted considerable lower relative biomass ( Figure 9). It is particularly noteworthy that the CPUE series have been decreasing since 2012, causing biomass trends to adjust to a lower minimum compared to the previous assessments. The Committee noted that the 2017 assessment represents a significant improvement in the understanding of current stock status for North Atlantic swordfish using updated information and integration of the new data sources. The Committee therefore recommends that management advice for North Atlantic swordfish, including stock status and projections, should be based on BSP2 and SS3 models. 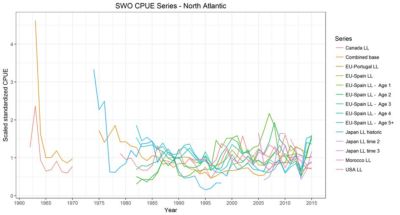 | | Figure 4: Standardized CPUEs series provided by CPCs for the North Atlantic swordfish and the combined index for the base continuity production model. The CPUE series were scaled to their mean for comparison purposes. |
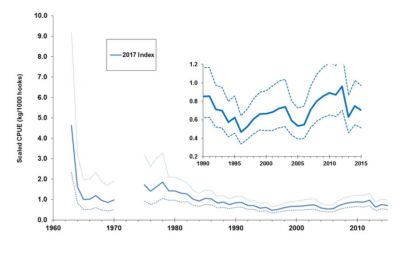 | | Figure 5: Standardized combined biomass CPUE index for North Atlantic and 95% confidence intervals, used as the continuity run for the production models. The inset plot shows the detail of the index trend since 1990. |
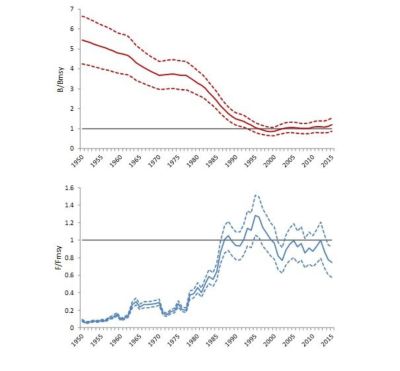 | | Figure 6: Results from the North Atlantic swordfish base case SS3 model: trends in relative biomass (top) and fishing mortality (bottom). Dashed lines represent lower and upper 95% CIs. |
 | | Figure 7: Results from the North Atlantic swordfish base case BSP2 model: trends in relative biomass and fishing mortality. Dashed lines represent lower and upper 90% CIs. |
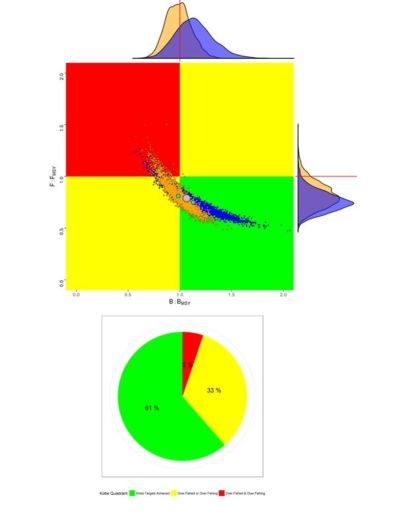 | | Figure 8: North Atlantic swordfish stock status terminal points (2015) from the base SS and BSP2 models. The solid light blue circle is the estimated median point with the respective uncertainties from each model (BSP2 in orange and SS3 in dark blue). The larger light grey circle is the estimated overall median from both models. The pie chart below represents the probabilities of stock being in the different color quadrants combined form both models (red 5%, yellow 33%, green 61%). |
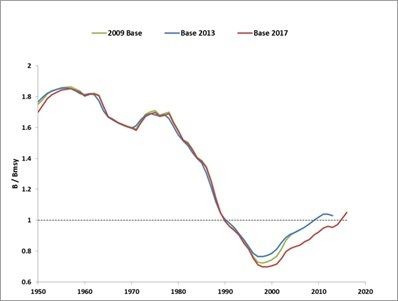 | | Figure 9: Comparison of relative biomass trends estimated by the ASPIC base case model for the 2009, 2013 and 2017 North Atlantic swordfish stock assessments. |
Results Projection OutlookResults from the previous 2013 assessment indicated that there was a greater than 90% probability that the northern swordfish stock had rebuilt to or above B MSY. However, given the new estimates of biomass and lower productivity, the stock status now shows a 61% probability of being above B MSY. Based on the currently available information to the Committee, both the BSP2 and SS3 base models were projected to the year 2028 under constant TAC scenarios of 8 to 19 thousand tons. Projections used reported catch as of July 2017 for 2016. For those CPCs whose reported catch was not available, their catch was assumed to be the average of the last three years (2013-2015), giving a total catch of 11,296 t. For the final base case BSP2 model, projections incorporated process error and the predicted trajectories are therefore more realistic of the future uncertainty in the stock status. MSY is estimated to be around 13,400 t, and taking into account current stock status and process error catches around 13,000 t are expected to allow the population to remain at or above B MSY throughout the projected time period ( Figure 10). For the final base case SS3 model, projections of stock status at various levels of future catch are shown in Figure 10. Given the current status of the stock being quite close to the MSY benchmarks, values of catches around 13,000 t are also projected to maintain biomass above B MSY during the projected time frame. 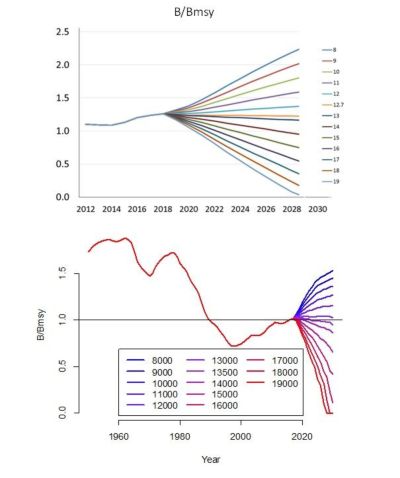 | | Figure 10: Median trends of relative biomass (B/BMSY) for the projected North Atlantic swordfish stock based on the SS3 (top) and BSP2 (bottom) base case models under different constant catch scenarios (thousand tons). |
Management Management unit: Yes Effects of current regulationsIn 2017, the Committee provided information on the effectiveness of existing minimum size regulations. New catch regulations were implemented on the basis of Rec. 06-02, which entered into effect in 2007 (Rec. 08-02 extended the provisions of Rec. 06-02 to include 2009). Rec. 09-02 came into effect in 2010 and extended most of the provisions of Rec. 06-02 for one year only. Rec. 10-02 came into effect in 2011, and again extended those provisions for one year only, but with a slight reduction in total allowable catch (TAC). For the North Atlantic swordfish the most recent recommendations can be found in Rec. 17-02. The total allowable catch in the North Atlantic during the 2007 to 2009 period was 14,000 t per year. The reported catch during that period averaged 11,811 t and did not exceed the TAC in any year. In 2010, the TAC was reduced to 13,700 t. The reported catch since then averaged 11,472 t and exceeded the TAC in one year (2012, 13,868 t). There are two minimum size options that are applied to the entire Atlantic: 125 cm LJFL with a 15% tolerance, or 119 cm LJFL with zero tolerance and evaluation of the discards. Since the implementation of the minimum landing sizes in 2000, the estimate of percentage of swordfish less than 125 cm LJFL reported landed (in number) has been generally decreasing in the North Atlantic, the estimate was 33% in 2000 and decreased to 23% in 2015. The Committee notes that these estimations have high levels of substitutions for a significant portion of the total catch and are highly unreliable and biased unless CPCs fully report size samples from the entire catch. The Committee also noted high values of hooking mortality (ranging between 78-88%) on small swordfish (<125 cm LJFL) on some surface longline fisheries targeting swordfish, with the post-release mortality of specimens discarded alive unknown. Recommend and evaluating other strategies to protect juvenile swordfish will need completeness of datasets on fishing effort and size data over the entire Atlantic and should take into account the effects on other species. In view of the Commission objective to protect small swordfish, the Committee therefore recommends that future work should be carried out to determine more precisely the spatial distribution and magnitude of fishing effort, size and sex distribution of undersized swordfish in the Atlantic, using high resolution observer data. Advice Tables 2, 3 and 4 show, respectively, the probabilities of maintaining the stock in the green quadrant of the Kobe plot, maintaining B>B MSY and maintaining F<F MSY, over a range of TAC options for North Atlantic swordfish over a period of 10 years. The current TAC of 13,700 t has a 36% probability of maintaining the North Atlantic swordfish stock in the green quadrant of the Kobe plot by 2028, whereas a TAC of 13,200 t would have a 50% probability, and would also result in the biomass being above B MSY with a probability greater than 50%, consistent with Rec. 16-03 ( Table 3). The Committee also recognizes that the above advice does not account for removals associated with the actual mortality of unreported dead and live discards, quota carryovers (15% in the North Atlantic), quota transfers across the North and South stock management boundaries nor the total cumulative quota, which includes that allocated to "other CPCs" and would fall above the TAC if achieved. The Committee emphasizes the importance of this uncertainty particularly given that the current estimated biomass is close to B MSY. | NORTH ATLANTIC SWORDFISH SUMMARY | | Maximum Sustainable Yield | 13,059 (11,840-14,970)1 | | Current (2017) TAC | 13,700 t | | Current (2017) Yield2 | 10,046 t | | Yield in last year used in assessment (2015)3 | 10,668 t | | BMSY | 82,640 t (51,580-132,010)4 | | SSBMSY | 21,262 t (14,797-27,728)5 | | FMSY | 0.17 (0.10-0.27)1 | | Relative Biomass (B2015/BMSY) | 1.04 (0.82 - 1.39)6 | | Relative Fishing Mortality (F2015/FMSY) | 0.78 (0.62-1.01)6 | | Stock Status (2015) | Overfished: NO | | | Overfishing: NO | | Management Measures in Effect | Country-specific TACs [Recs. 17-02, 06-02]; 125/119 cm LJFL minimum size | 1 Average from base case BSP2 and SS models; range corresponding to the lowest and highest 95% CIs from the two models. 2 Provisional and subject to revision. 3 Based on catch data available in July 2017 for the stock assessment session. 4 From base case BSP2 model, with 95% CIs. 5 From base case SS model, with 95% CIs. 6 Median and 95% quantiles from base case SS and BSP2 models. 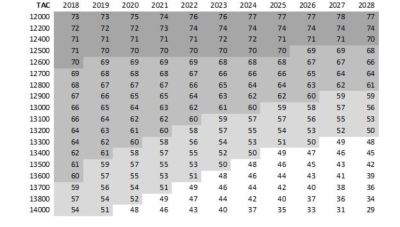 | | Table 2: Estimated probabilities (%) that both the fishing mortality is below FMSY and biomass is above BMSY for North Atlantic swordfish from BSP2 and SS final base models. |
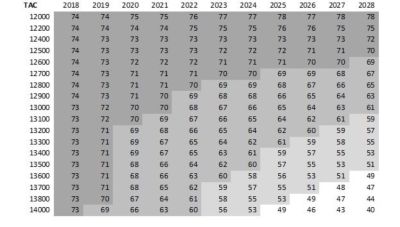 | | Table 3: Estimated probabilities (%) that biomass is above BMSY for North Atlantic swordfish from BSP2 and SS final base models. |
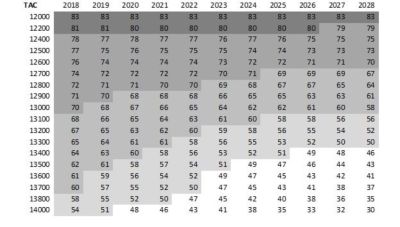 | | Table 4: Estimated probabilities (%) that fishing mortality is below FMSY for North Atlantic swordfish from BSP2 and SS final base models |
Sources Report for biennial period, 2016-17 PART I (2017) – Vol. 2 SCRS. Madrid, Spain 2018.  https://www.iccat.int/Documents/BienRep/REP_EN_16-17_II-2.pdf https://www.iccat.int/Documents/BienRep/REP_EN_16-17_II-2.pdf |
|
| |
|
|