Northern Bluefin tuna - Western Atlantic|
| Fact Sheet Title Fact Sheet |
| | | Northern Bluefin tuna - Western Atlantic |
 | Northern bluefin tuna in the Western Atlantic |
| | Data Ownership | | This document owned by International Commission for the Conservation of Atlantic Tunas (ICCAT), provided and maintained by Standing Committee on Research and Statistics , is part of ICCAT SCRS Reports data collection. |
| | ident Block | ident Block | | | | Species List: | | Species Ref: en - Atlantic bluefin tuna, fr - Thon rouge de l'Atlantique, es - Atún rojo del Atlántico, ar - تونة حمراء أطلسيَّة, zh - 大西洋蓝鳍金枪鱼 |
|
|
| ident Block Northern Bluefin tuna - Western Atlantic Map tips - Click on
 to turn layers on and off to turn layers on and off - Double-click to zoom in
- Drag to pan
- Hold down the shift key and drag to zoom to a particular region
| iccat Smu |
|---|
| BFT_W | West Atlantic |
|---|
|
|
|
|
| | Aq Res | Biological Stock: Yes Value: Regional
Management unit: Yes Reference year: 2014
|
| Considered a management unit: An aquatic resource or fishery is declared as [Fishery] Management Unit if it is effectively the focus for the application of selected management methods and measures, within the broader framework of a management system. According to the FAO Glossary for Responsible Fishing, "a Fishery Management Unit (FMU) is a fishery or a portion of a fishery identified in a Fishery Management Plan (FMP) relevant to the FMP's management objectives." FMU's may be organised around fisheries biological, geographic, economic, technical, social or ecological dimensions , and the makeup and attribute of a fishery management unit depends mainly on the FMP's management objectives. |
| Jurisdictional distribution: Jurisdictional qualifier (e.g. "shared", "shared - highly migratory") of the aquatic resource related with its spatial distribution. |
| Environmental group: Classification of the aquatic resource according to the environmental group (e.g. pelagic invertebrate, or demersal fish) to which the species belong. |
| Reference Year: The Reference Year is the last year considered in the stock assessment and/or fishery status. |
| | | | | | History In 2014, the SCRS conducted an update of the 2012 assessment of Atlantic bluefin tuna (Anon. 2013). In this update, the available data included catch, effort and size statistics through 2013. As previously discussed, there are considerable data limitations for the eastern stock up to 2007. While catch data reporting for the eastern and Mediterranean fisheries has substantially improved since 2008 and some historical statistical data have been recovered, none-the-less, most of the data limitations that have plagued previous assessments remain and will require new approaches in order to improve the scientific advice the Committee can offer. The SCRS strongly recommends the continuation of enhanced data collection program and the replacement of current assessment methods with appropriate approaches that take unquantified uncertainties into account. During the last decade, there has been an overall shift in targeting towards large bluefin tuna, mostly in the Mediterranean. As the majority of these fish are destined for fattening and/or farming operations, it is crucial to get precise information about the total catch, the size composition, the area and flag of capture. Progress has however been made over the last years and therefore the Committee investigated in 2013-2014 the size data retrieved from the observer on board of cages programmes (see SCRS/2013/014). There was considerable quantity of information that were analyzed and compared to current catch at size. These data appeared to be of good quality and the Committee recommended the integration of this new valuable source of information in the Task II database prior to the next stock assessment (work to be completed during the 2015 bluefin tuna data Working Group). Pilot studies using dual camera system or acoustic coupled with video system have been presented at the SCRS since 2010. The results are encouraging and last studies showed that this technique can provide precise catch composition when it is used with a proper and well defined protocol (see SCRS/2013/182; Deguara et al., 2014 ). The Atlantic-wide Research Program for Bluefin Tuna (GBYP) research plan outlined the research necessary for improving the scientific advice that the Committee provides to the Commission. This plan was presented to and approved by the Commission and the GBYP was started in 2010. The Committee continues to strongly and unanimously support the GBYP, particularly with respect to obtain fisheries-independent indices of stock size, and welcomes the Commission’s continued commitment to the Program. In the absence of such a significant and sustained effort, it remains highly unlikely that the Committee will improve its scientific diagnosis and management advice in the foreseeable future. In 2012, 2013, and 2014, the SCRS also reviewed new information on the biology, spatial dynamics, catch statistics and fisheries catch rates. The SCRS also discussed progress made by the GBYP and other research program about the aerial survey, tagging, data mining, biological sampling, stock mixing and new modeling approaches (see SCRS/2012/139; Di Natale and Idrissi, 2013 and SCRS/2013/014; Anon. 2014). Habitat Bio Climatic Zone: Temperate. Vertical Dist: Pelagic. Atlantic bluefin tuna (BFT) mainly live in the pelagic ecosystem of the entire North Atlantic and its adjacent seas, primarily the Mediterranean Sea. Bluefin tuna have a wide geographical distribution living mostly in temperate Atlantic waters and adjacent seas (Figure 1). Archival tagging and tracking information confirmed that bluefin tuna can sustain cold as well as warm temperatures while maintaining stable internal body temperature. Bluefin tuna preferentially occupy the surface and subsurface waters of the coastal and open-sea areas, but archival tagging and ultrasonic telemetry data indicate that bluefin tuna can frequently dive to depths of more than 1,000 m. Bluefin tuna is also a highly migratory species that seems to display a homing behavior and spawning site fidelity in both the Mediterranean Sea and Gulf of Mexico, which constitute the two main spawning areas being clearly identified today. Less is known about feeding migrations within the Mediterranean and the North Atlantic, but results from electronic tagging indicated that bluefin tuna movement patterns vary considerably between individuals, years and areas. The appearance and disappearance of important past fisheries further suggest that important changes in the spatial dynamics of bluefin tuna may also have resulted from interactions between biological factors, environmental variations and fishing. Although the Atlantic bluefin tuna population is managed as two stocks, conventionally separated by the 45°W meridian, its population structure remains poorly understood and needs to be further investigated. Recent genetic and microchemistry studies as well as work based on historical fisheries tend to indicate that the bluefin tuna population structure is complex. Currently, the SCRS assumes that eastern Atlantic and Mediterranean bluefin tuna mature at approximately 25 kg (age 4) and western Atlantic bluefin tuna at approximately 145 kg (age 9). Recent information received by the SCRS indicated that some individuals caught in the West Atlantic as small as 47 kg (age 5) were mature. Juvenile and adult bluefin tuna are opportunistic feeders (as are most predators). However, in general, juveniles feed on crustaceans, fish and cephalopods, while adults primarily feed on fish such as herring, anchovy, sand lance, sardine, sprat, bluefish and mackerel. Juvenile growth is rapid for a teleost fish, but slower than other tuna and billfish species. Fish born in June attain a length of about 30-40 cm long and a weight of about 1 kg by October. After one year, fish reach about 4 kg and 60 cm long. At 10 years old, a bluefin tuna is about 200 cm and 170 kg and reaches about 270 cm and 400 kg at 20 years. Bluefin tuna is a long-lived species, with a lifespan of about 40 years, as indicated by recent studies from radiocarbon deposition. The Committee evaluated information from the bluefin meeting on biological parameters hold in 2013 and bluefin species group meetings in 2014 (SCRS/2013/014; SCI-030; 2014 bluefin tuna assessment detailed report). New contributions have been presented from GBYP and national research projects on reproduction, direct age estimations, population structure, spawning areas and larval studies. New modeling has been conducted using a comprehensive dataset that facilitates length weight-length relationships to reflect the timing and area of spawning which the Committee feels adequate for assessment modeling and are adopted. While further analyses have to be performed to improve the adopted relationship, future assessment will rely on these relationships. Sensitivity analyses will be carried out to analyze the impact of these new relationships on the stock assessment. Substantial progress has been made in estimating regional mixing levels for Atlantic bluefin tuna from otolith stable isotope analysis. Research on larval ecology of Atlantic bluefin tuna has advanced in recent years through oceanographic habitat suitability models. Direct age estimations have been calibrated between readers from several institutions. An important electronic and conventional tagging activity on both juveniles and adults fish has been performed in the East Atlantic and Mediterranean by GBYP, national programmes and NGOs. These ongoing efforts have started to provide significant insight into bluefin tuna stock structure, mixing and migrations and would possibly help in estimating fishing mortality rates. The Committee recognized that there have been important recent contributions to the understanding of bluefin tuna biology and ecology that should have significant impacts on the assessment of the resource. Geo Dist Geo Dist: Highly migratory Bluefin tuna have a wide geographical distribution living mostly in temperate Atlantic waters and adjacent seas (Figure 1). Water Area Overview  | | Water Area Overview Northern Bluefin tuna - Western Atlantic
| iccat Smu | BFT_W: West Atlantic |
| | | | | | Water Area Overview |
Water Area OverviewNorthern Bluefin tuna - Western Atlantic Aq Res Struct Biological Stock: Yes Bluefin tuna is also a highly migratory species that seems to display a homing behavior and spawning site fidelity in both the Mediterranean Sea and Gulf of Mexico, which constitute the two main spawning areas being clearly identified today. Less is known about feeding migrations within the Mediterranean and the North Atlantic, but results from electronic tagging indicated that bluefin tuna movement patterns vary considerably between individuals, years and areas. The appearance and disappearance of important past fisheries further suggest that important changes in the spatial dynamics of bluefin tuna may also have resulted from interactions between biological factors, environmental variations and fishing. Although the Atlantic bluefin tuna population is managed as two stocks, conventionally separated by the 45°W meridian, its population structure remains poorly understood and needs to be further investigated. Recent genetic and microchemistry studies as well as work based on historical fisheries tend to indicate that the bluefin tuna population structure is complex. The Committee evaluated information from the bluefin meeting on biological parameters hold in 2013 and bluefin species group meetings in 2014 (SCRS/2013/014; SCI-030; 2014 bluefin tuna assessment detailed report). New contributions have been presented from GBYP and national research projects on reproduction, direct age estimations, population structure, spawning areas and larval studies. Substantial progress has been achieved by the GBYP “Biological Sampling and Analysis” program in relation to stock structure (genetics and microconstituents) and direct age estimations. An important electronic and conventional tagging activity on both juveniles and adults fish has been performed in the East Atlantic and Mediterranean by GBYP, national programmes and NGOs. These ongoing efforts have started to provide significant insight into bluefin tuna stock structure, mixing and migrations and would possibly help in estimating fishing mortality rates. Substantial progress has been made in estimating regional mixing levels for Atlantic bluefin tuna from otolith stable isotope analysis The Committee recognized that there have been important recent contributions to the understanding of bluefin tuna biology and ecology that should have significant impacts on the assessment of the resource.  | Figure1 Geographic distribution of bluefin tuna catches per 5x5 degrees and per main gears from 1950 to 2012.  |
Exploit Fishery indicatorsThe total catch for the West Atlantic peaked at 18,671 t in 1964, mostly due to the Japanese longline fishery for large fish off Brazil (that started in 1962) and the U.S. purse seine fishery for juvenile fish (( Table1 ), Figure 2). Catches dropped sharply thereafter with the collapse of the bluefin tuna by-catch longline fishery off Brazil in 1967 and decline in purse seine catches, but increased again to average over 5,000 t in the 1970s due to the expansion of the Japanese longline fleet into the northwest Atlantic and Gulf of Mexico and an increase in purse seine effort targeting larger fish for the sashimi market. The total catch for the West Atlantic including discards has been relatively stable since 1982 due to the imposition of quotas. However, since a total catch level of 3,319 t in 2002 (the highest since 1981, with all three major fishing nations indicating higher catches), total catch in the West Atlantic declined steadily to a low of 1,638 t in 2007 and then increased in 2008 and 2009 to 2,000 t and 1,980 t, respectively. The catch in 2013 was 1,484 t (Figure 2). The decline through 2007 was primarily due to considerable reductions in catch levels for U.S. fisheries. Since 2002, the Canadian annual catches have been relatively stable at about 500-600 t (735 t in 2006); the 2006 catch was the highest recorded since 1977 (972 t). The 2013 Canadian catch (including dead discards) was 480t. Japanese catches have generally fluctuated between 300-500 t, with the exception of 2003 (57 t), which was low for regulatory reasons, and 2009 (162 t). Japanese landings for 2011 were considerably higher than previous at 578 t, while catches in 2012 and 2013 were 289 t and 317, respectively. The average weight of bluefin tuna taken by the combined fisheries in the West Atlantic were historically low during the 1960s and 1970s (Figure 3), for instance showing an average weight of only 33 kg during the 1965-1975 period. However, since 1980 they have been showing a quite stable trend and at a quite high average weight of 93 kg. The overall number of Japanese vessels engaged in bluefin fishing has declined from more than 100 vessels to currently less than 10 vessels in the West Atlantic. After reaching a catch level of 2,014 t in 2002 (the highest level since 1979), the catches (landings and discards) of U.S. vessels fishing in the northwest Atlantic (including the Gulf of Mexico) declined precipitously during 2003-2007. The United States did not catch its quota in 2004-2008 with catches of 1,066, 848, 615, 858 and 922 t, respectively. However, in 2009 the United States fully realized its base quota with total catches (landings including dead discards) of 1,273 t and since that time catches have remained around 900 t with catches in 2012 of 915 t and in 2013 of 659 t. The indices of abundance used in the 2014 assessment were updated through 2013 (Figure 4). The catch rates of juvenile bluefin tuna in the U.S. rod and reel fishery fluctuate with little apparent long-term trend, but exhibit a pattern that is consistent with the strong year-classes estimated for 2002 and 2003and showed small decreases in 2012 and 2013. The catch rates of adults in the U.S. rod and reel fishery showed decreases between 2011 and 2013. Catch rates of the Japanese longline fishery north of 30oN has fluctuated substantially over time but in recent years (2011-2013) have increased to the highest values of the time series. The catch rate series from the U.S. Gulf of Mexico longline fishery was split after 1991 due to management related impacts upon the indices and was also adjusted for the effects of ‘weak’ hook regulations implemented in 2011. The early time period (1987-1991) shows no clear trend while the later time period shows a generally increasing trend. Indices for the Gulf of St. Lawrence have increased rapidly since 2004 and the catch rates in 2011-2013 were the highest in the time series. The Committee questioned if the rate of increase was biologically plausible, and noted that many factors may have contributed to the increase, including changes in stock distribution, management regulations, fishing behavior and the environment, and may not have been fully accounted for in the standardization. Catch rates in southwest Nova Scotia have shown a recent decrease since 2008. The Gulf of Mexico larval survey (the only fishery independent indicator) continues to fluctuate around the low levels observed since the 1980s but 2011 and 2013 were relatively high. The general increasing trends for several indices indicate an increasing biomass, however conflicting trends between several of the indices (e.g. Canada Gulf of St. Lawrence and U.S. rod and reel) and the potential influence of unaccounted factors described above make the magnitude of this increase uncertain. 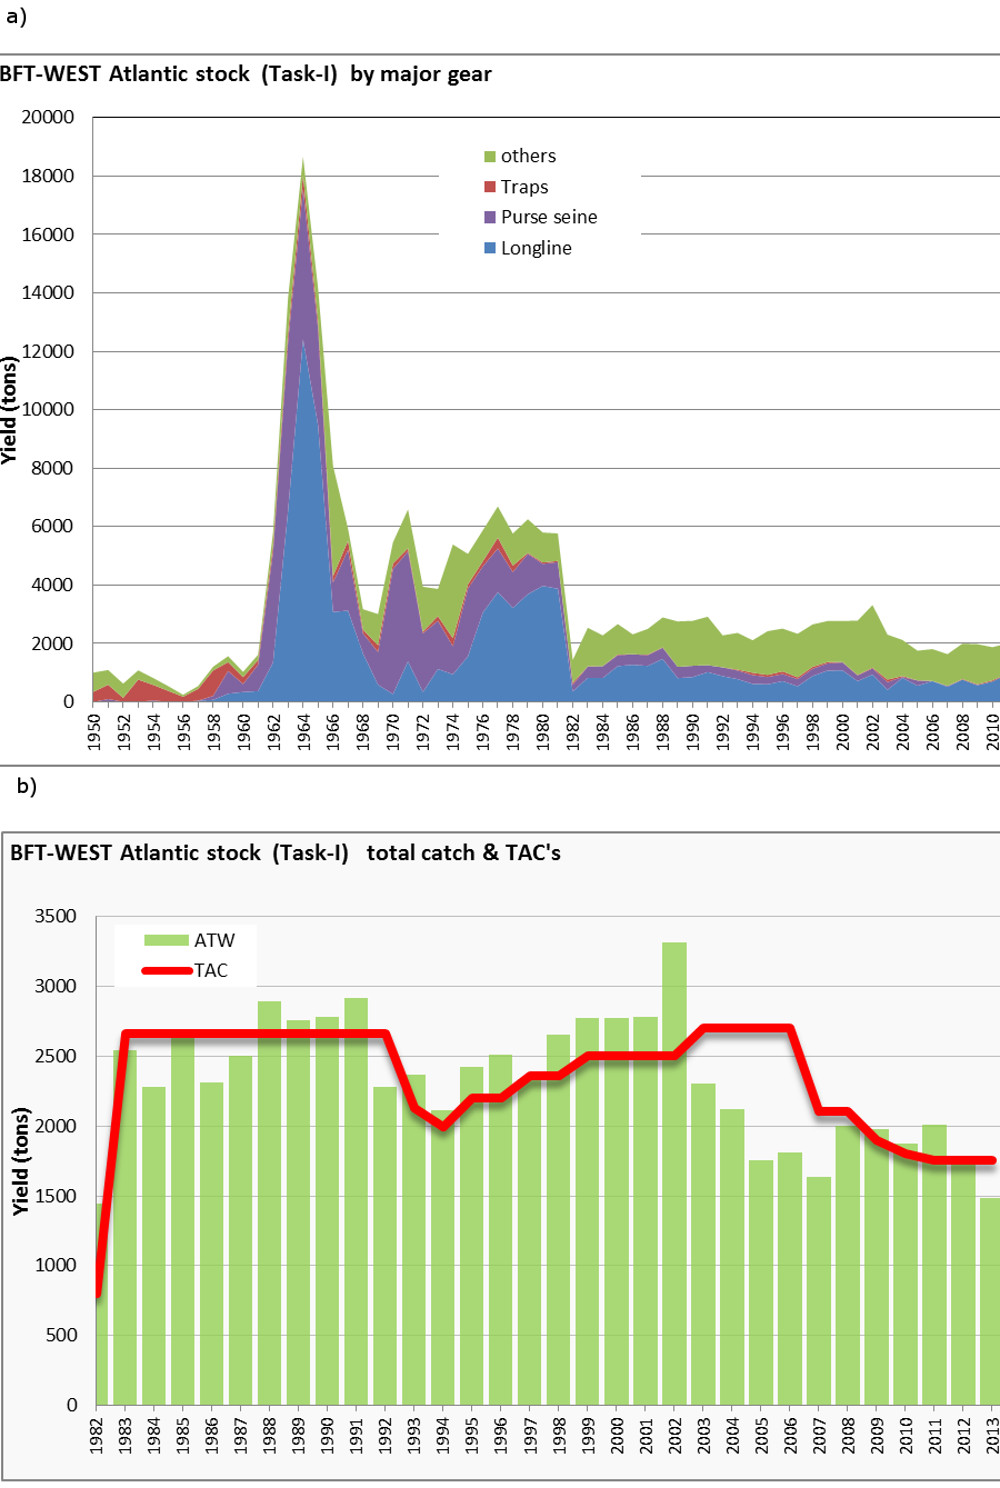 | | Figure 2 Historical catches of western bluefin tuna: (a) by gear type and (b) in comparison to TAC levels agreed by the Commission. |
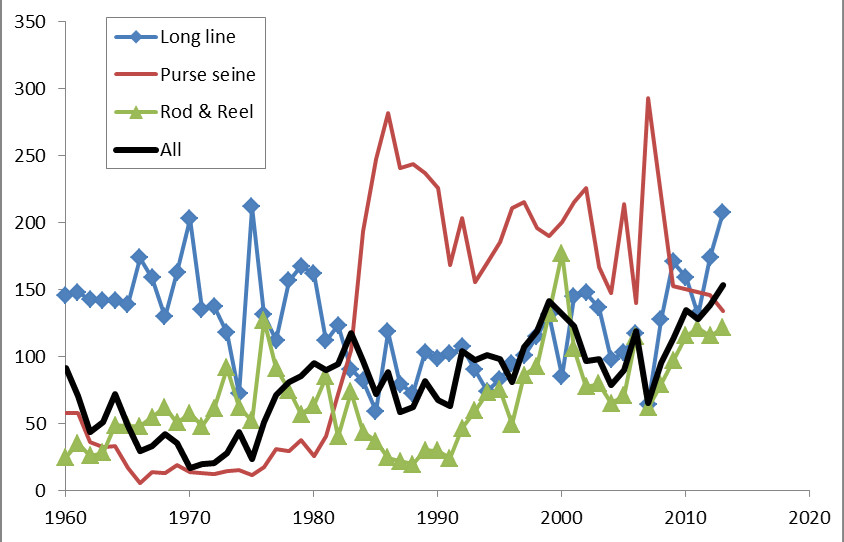 | | Figure 3 Mean weight of western bluefin tuna catches by purse seine, longline, rod and reel, and all gears combined (estimated from the catch-at-size compiled information). |
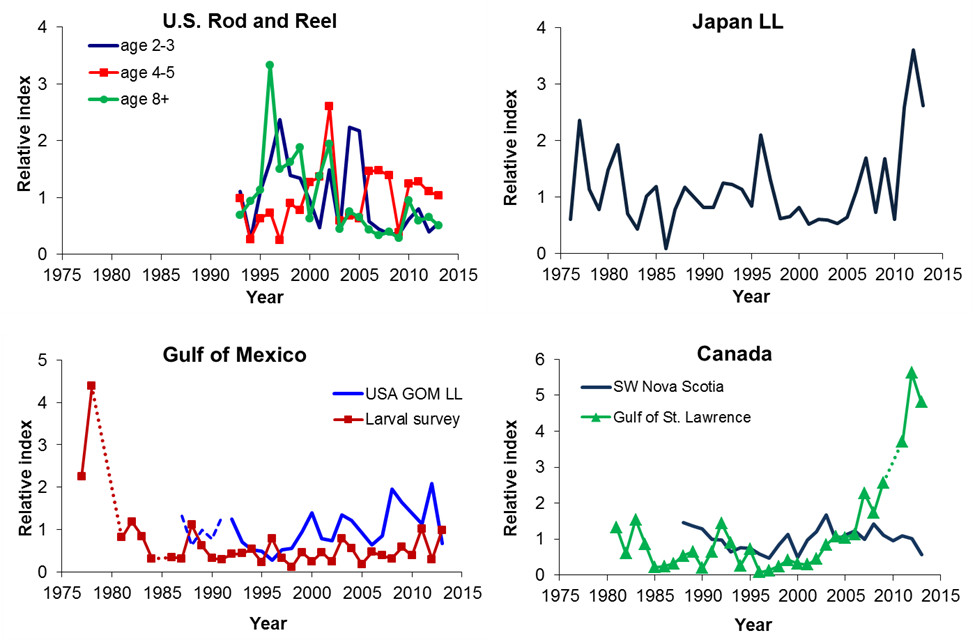 | | Figure 4 Updated indices of abundance for western bluefin tuna. The dashed portions of the larval survey, U.S. Gulf of Mexico, and Canada Gulf of St. Lawrence indices bridge the gaps between years where data were missing or otherwise considered unreliable by the 2014 SCRS (and not used in the base assessment). |
Bio Assess Assess Models The present update assessment included information through 2013 (Anon. 2013d). The SCRS cautions that the conclusions of this assessment do not capture the full degree of uncertainty in the assessments and projections. An important factor contributing to uncertainty is mixing between fish of eastern and western origin. Based on earlier work, the estimates of stock status can be expected to vary considerably depending on the type of data used to estimate mixing (conventional tagging or isotope signature samples) and modeling assumptions made. Mixing models will be further investigated prior to the next assessment. Another important source of uncertainty is recruitment, both in terms of recent levels (which are estimated with low precision in the assessment), and potential future levels (the "low" vs. "high" recruitment potential hypotheses which affect management benchmarks, Figure 5). Improved knowledge of maturity at age will also affect the perception of changes in stock size. Finally, the lack of representative samples of otoliths requires determining the catch at age from length samples, which is imprecise for larger bluefin tuna. Many of these deficiencies are being addressed by current research programs. Assessment results were sensitive to certain assumptions and data treatments, including the abundance indices. Exclusion of the Canadian GSL index decreased the biomass estimate by 33%, whereas exclusion of the US large RR index increased biomass by about 25%. However both indices were included as the committee felt they captured the potential redistribution of the stock within the management area. The 2014 assessment estimated trends that are consistent with previous analyses in that spawning stock biomass (SSB) declined steadily from 1970 to 1992and then fluctuated around 25 to 30% the 1970 level for about the next decade (Figure 6). In recent years, however, there appears to have been a gradual increase in SSB from about 32% of the 1970 level in 2003 to an estimated 55% in 2013. Since 1998, when the rebuilding plan was adopted, the SSB has increased by 70%. The stock has experienced different levels of fishing mortality (F) over time, depending on the size of fish targeted by various fleets (Figure 6). Fishing mortality on spawners (ages 9 and older) declined markedly after 2003. Estimates of recruitment were very high in the early 1970s (Figure 6), and previous analyses involving longer catch and index series suggest that recruitment was also high during the 1960s. Since 1977, recruitment has varied from year to year without trend with the exception of strong year-classes in 2002 and 2003. The current assessment suggests that both the 2002 and 2003 year classes were large; but the estimate of a strong 2002 year class may be an artefact of the lack of direct observations of the age of fish in the catch and recent regulations in the United States that limited the take of fish in that size range. Under the current maturity assumptions (age 9 and older) the 2002/2003 year classes started to contribute to the spawning biomass in 2011/2012. A key factor in estimating MSY-related benchmarks is the highest level of recruitment that can be achieved in the long term. Assuming that average recruitment cannot reach the high levels from the early 1970s, recent F (2010-2013) is 36% of F MSY and SSB 2013 is about 225% of SSB MSY (Figure 7 and Figure 8). In contrast, estimates of stock status are more pessimistic with respect to spawning biomass if a high recruitment potential scenario is considered, with F =88% of F MSY and SSB 2013 =48% of SSB MSY . However, the Committee notes that this is the first assessment where the stock was estimated to not be undergoing overfishing under both recruitment scenarios. Compared to the 2012 assessment, the 2014 assessment estimated higher levels of SSB for all years dating back to the late-1990s, largely due to a rapid increase in one index and corrections to account for regulatory changes in another. In addition, the SSB MSY currently estimated under the high recruitment potential scenario is is updated to be 33% lower than had been estimated during the 2012 assessment due to revised estimates of the high recruitment potential (Figure 5) scenario, and the SSB MSY currently estimated under the low recruitment potential scenario is updated to be 2% higher than had been estimated during the 2012 assessment. The re-estimation of the SSB MSY values resulted in a more optimistic perception of stock status, even under the high recruitment hypothesis. The increase in SSB between 2011 and 2013 estimated in the 2014 assessment is 5%. The Committee recognizes that the large uncertainty in stock status is exacerbated by the lack of appropriate information/data and scientific surveys, and suggests using a scientific research quota (as recommended previously by the SCRS) to help support the improvement of stock abundance indices for western Atlantic bluefin tuna and overcome this standstill situation. However, the Committee also points out that the collection of the information mentioned above is a long-term endeavour. 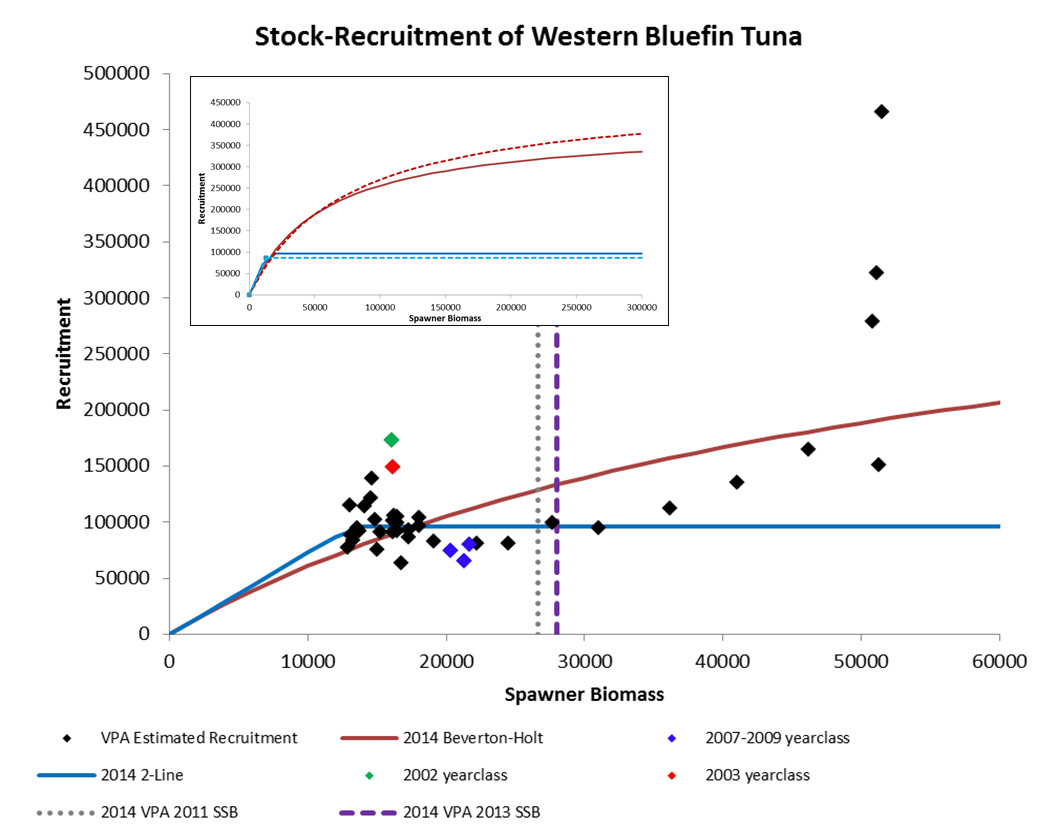 | | Figure 5 Recruitment scenario derived from the 2014 stock assessment. The low recruitment potential scenario (2-line) implies future recruitment will remain near present levels even if stock size increases. The ‘high recruitment potential scenario” (Beverton-Holt) implies future recruitment increases with stock size and has the potential to achieve levels that occurred in the early 1970s. Points represent the estimates from the 2014 base assessment, with the 2002, 2003, and recent year class estimates (2008-2010) highlighted. The two vertical lines represent SSB estimates from the 2014 assessment for 2011 (leftmost) and 2013 (rightmost). The inset graph shows the corresponding relationships estimated for the 2012 (dashed lines) and 2014 (solid lines) assessments illustrating the difference in the estimated stock recruitment relationship between 2012 and 2014. |
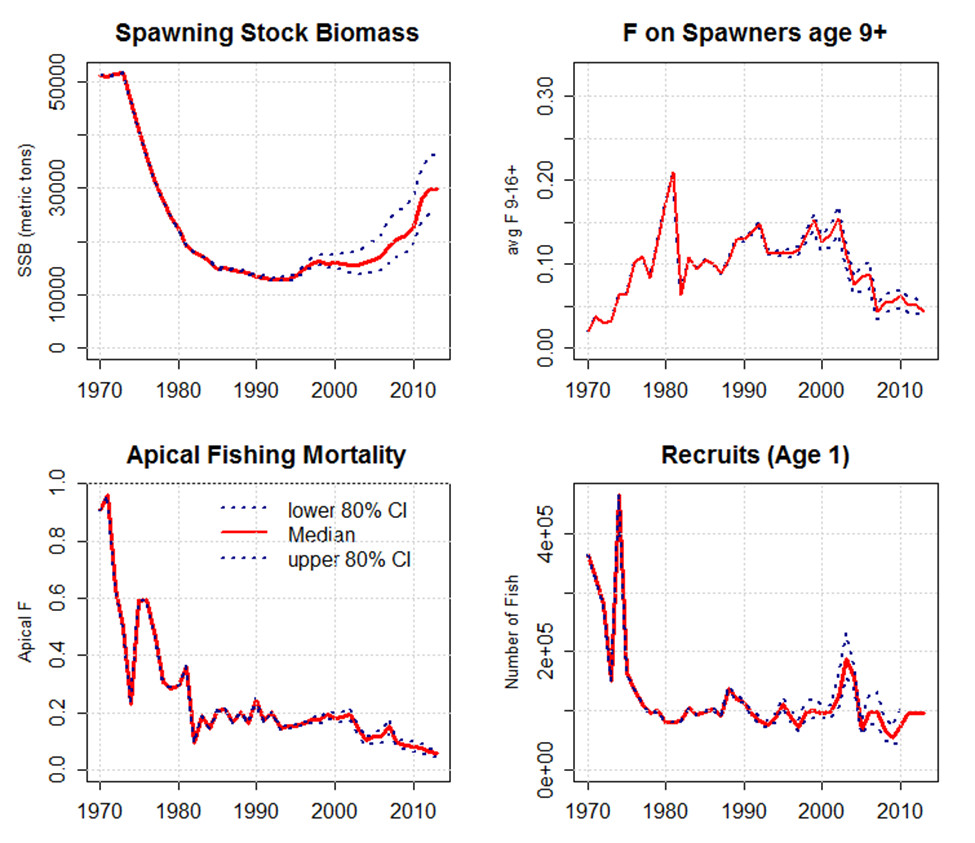 | | Figure 6 Median estimates of spawning biomass (age 9+), fishing mortality on spawners, apical fishing mortality (F on the most vulnerable age class) and recruitment for the base VPA model. The 80% confidence intervals are indicated with dotted lines. The recruitment estimates for the last three years of the VPA are considered unreliable and have been replaced by the median levels corresponding to the low recruitment scenario. |
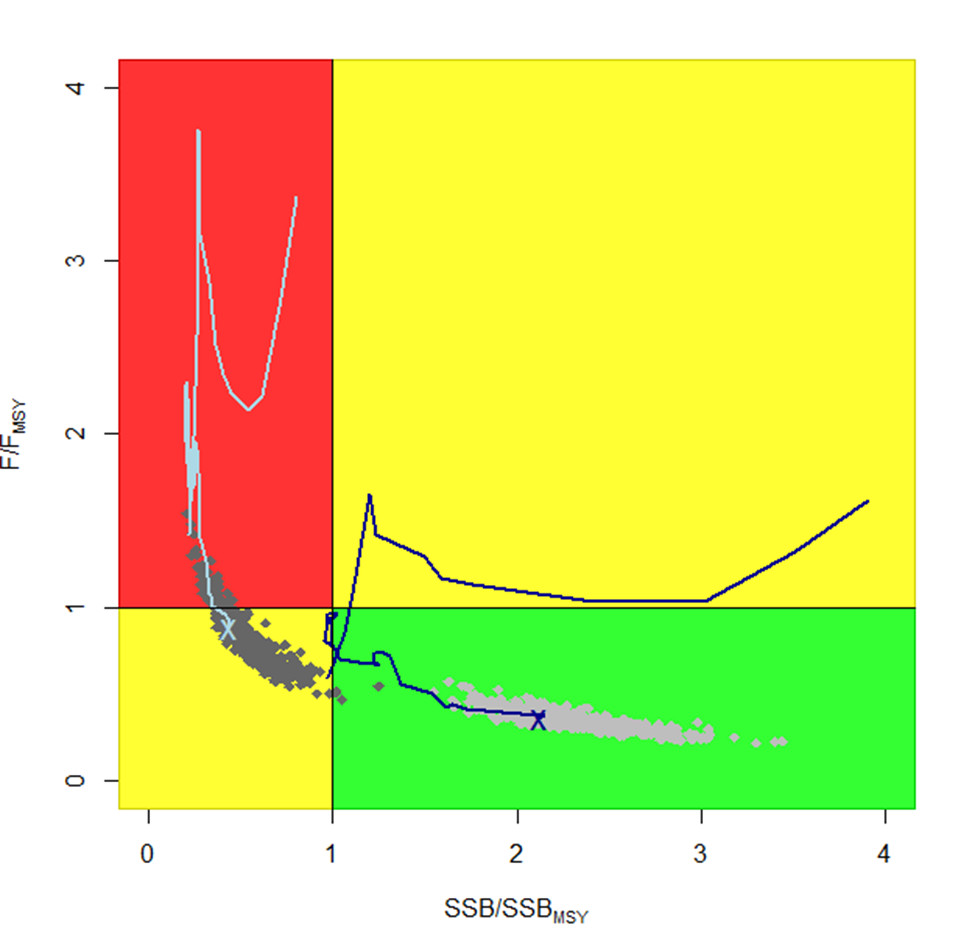 | | Figure 7 Estimated status of stock relative to the Convention objectives (MSY) by year (1973 to 2013) and recruitment scenario (light blue=high recruitment potential, dark blue=low recruitment potential). The light gray dots represent the status estimated for 2013 under the low recruitment scenario, corresponding to bootstrap estimates of uncertainty. The dark blue lines give the historical point estimates for the low recruitment, and the light blue gives the historic trend for the high recruitment. |
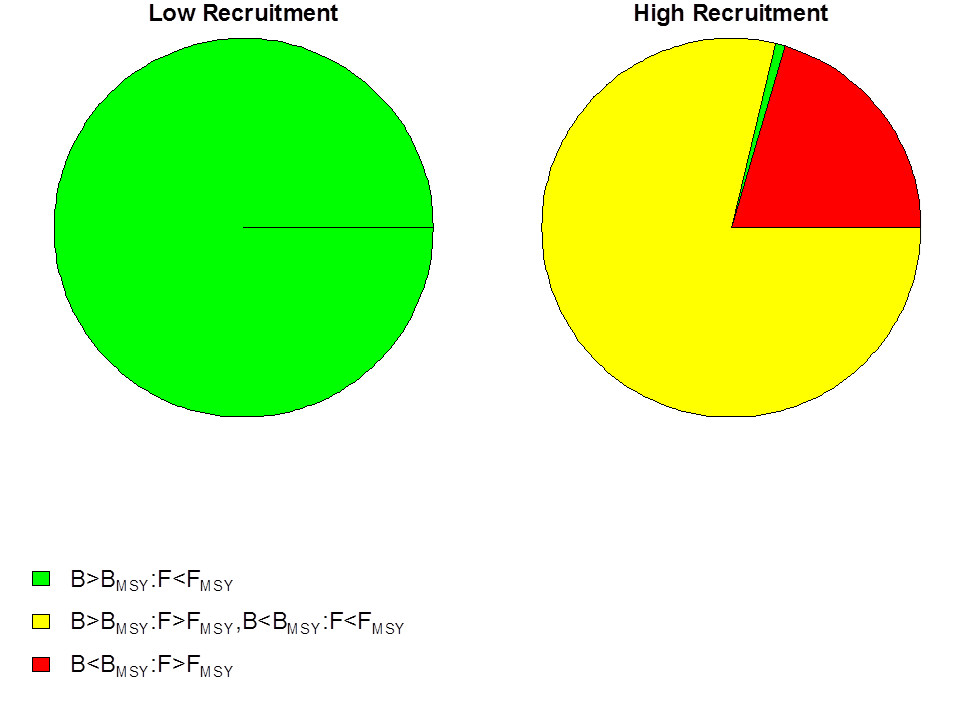 | | Figure 8 Pie chart summarizing stock status, showing the proportion of model outputs that are not overfished and not undergoing overfishing (green), either overfished or undergoing overfishing (yellow) and both overfished and undergoing overfishing (red). |
Results OutlookA medium-term outlook evaluation of changes in spawning stock size and yield over the remaining rebuilding period under various management options was conducted in 2014. Future recruitment was assumed to fluctuate under two scenarios: (i) average levels observed for 1976-2010 (96,500 fish, the low recruitment potential scenario) and (ii) levels that increase as the stock rebuilds (MSY level of 212,000 fish, the high recruitment potential scenario). The Committee has insufficient evidence to favor either scenario over the other and notes that both are plausible (but not extreme) lower and upper bounds on rebuilding potential. A preliminary analysis conducted after the assessment meeting indicated an improved fit of assessment outputs by the low recruitment potential hypothesis; however, the Committee could not agree whether this provided sufficient evidence to favour that scenario, in light of prior analyses that gave conflicting conclusions. The outlook for bluefin tuna in the West Atlantic is summarized in Figures 9-12. The low recruitment potential scenario suggests the stock is above the MSY level with greater than 60% probability and catches of 2,500 t or lower will maintain it above the MSY level. Constant catches of 2,250 t would result in a short-term minor decrease but with 2019 SSB approximately equal to that in 2013. If the high recruitment potential scenario is correct, then the western stock will not rebuild by 2019 even with no catch, although catches less than 2,500 t are predicted to prevent overfishing. The Committee reiterates that the effects of mixing and management measures on the eastern stock remains a considerable source of uncertainty for the outlook of the western stock. 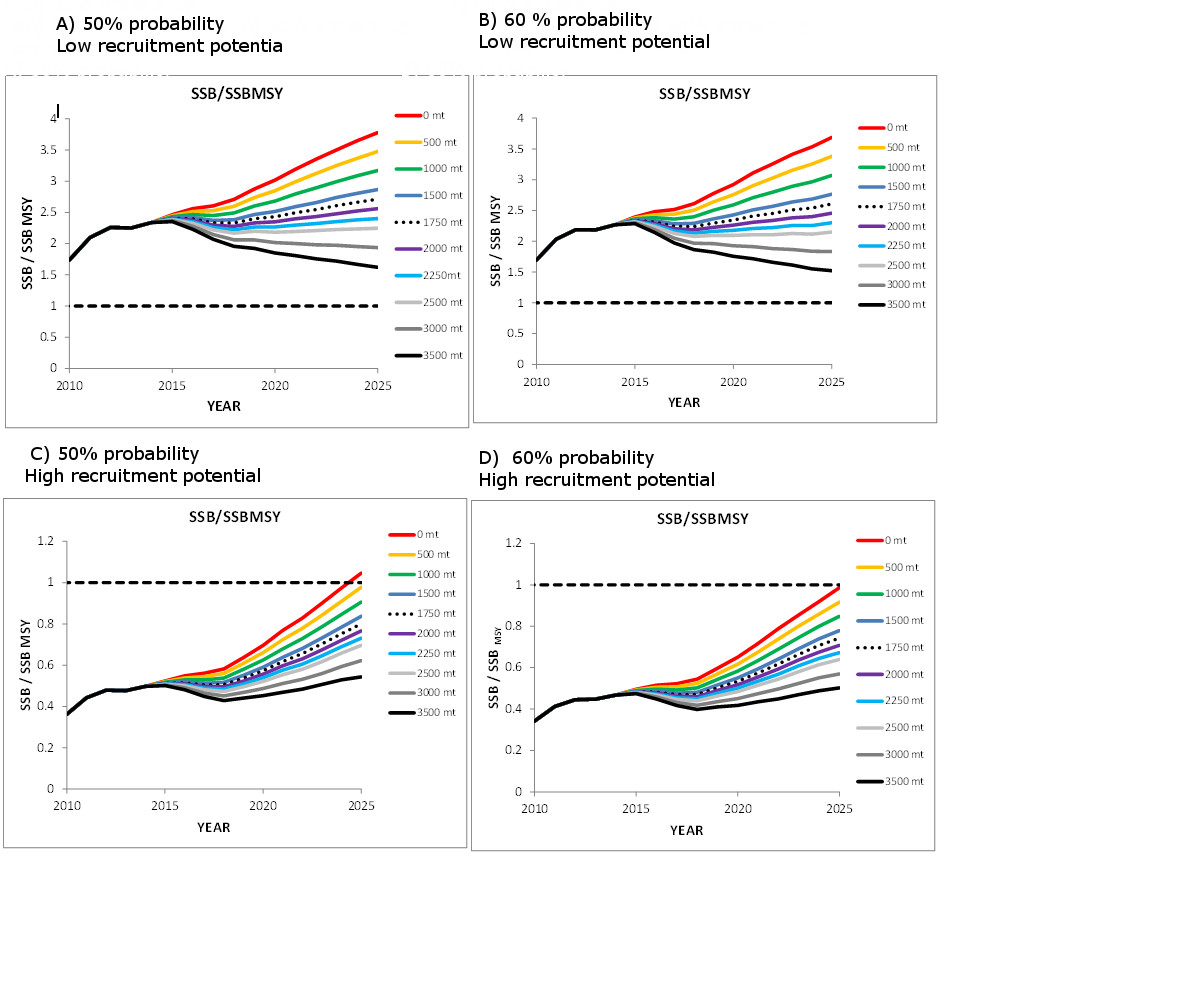 | | Figure 9 Projections of spawning stock biomass (SSB) for the Base Case assessment under low recruitment potential (top panels) and high recruitment potential (bottom panels) with an assumed catch of 1,750 mt in 2014 and various levels of constant catch starting in 2015. The labels “50%” and “60%” refer to the probability that the SSB will be greater than or equal to the values indicated by each curve. The curves corresponding to each catch level are arranged sequentially in the same order as the legends. A given catch level is projected to have a 50% or 60% probability of meeting the convention objective (SSB greater than or equal to the level that will produce the MSY) in the year that the corresponding curve meets the dashed horizontal line. |
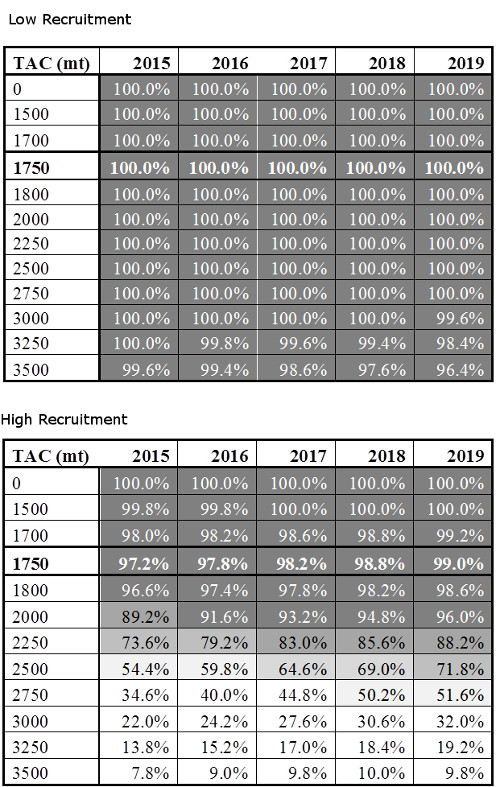
 | | Figure 10 Kobe II matrices (updated during the 2014 stock assessment) giving the probability that the spawning stock biomass will exceed the level that will produce MSY (SSB>SSBMSY, not overfished) in any given year for various constant catch levels under the low recruitment and high recruitment scenarios. The current TAC of 1,750 t [Rec. 13-09] is indicated in bold |
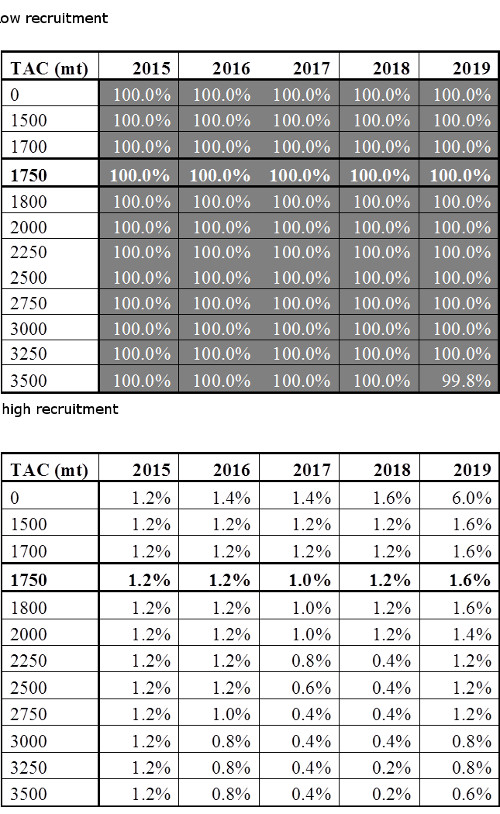
 | | Figure 11 Kobe II matrices (updated during the 2014 stock assessment) giving the probability that the fishing mortality rate (F) will be less than the level that will produce MSY (F<FMSY, no overfishing) in any given year for various constant catch levels under the low recruitment and high recruitment scenarios. The current TAC of 1,750 t [Rec. 13-09] is indicated in bold. |
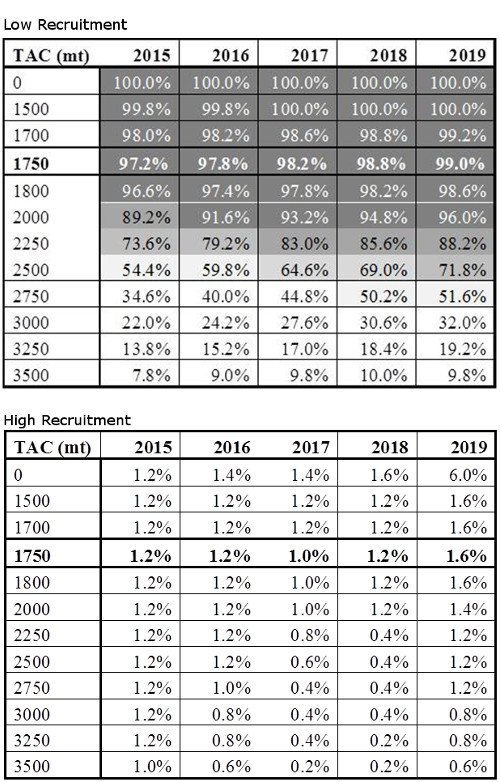 | | Figure 12 Kobe II matrices (updated during the 2014 stock assessment) giving the joint probability that the fishing mortality rate will be less than the level that will produce MSY (F<FMSY) and the spawning stock biomass (SSB) will exceed the level that will produce MSY (B>BMSY) in any given year for various constant catch levels under the low recruitment and high recruitment scenarios. The current TAC of 1,750 t [Rec. 13-09] is indicated in bold. |
Management Management unit: Yes Effects of current regulations The Committee previously noted that Recommendations 08-04, 10-03 and 12-02 were expected to result in a rebuilding of the stock towards the convention objective. The present assessment estimates that the spawning biomass has increased substantially in recent years, which is consistent with these expectations. Advice In 1998, the Commission initiated a 20-year rebuilding plan designed to achieve SSBMSY with at least 50% probability. In response to recent assessments, the Commission recommended a total allowable catch (TAC) of 1,900 t in 2009, 1,800 t in 2010 [Rec. 08-04] and 1,750 t in 2011, 2012, 2013 and 2014 [Rec. 10-03, Rec. 12-02, 13-09]. The 2014 assessment indicates similar historical trends in abundance as in previous assessments, but a more rapid increase in recent years. The strong 2002/2003 year classes and recent reduction in fishing mortality have contributed to this in recent years. Future stock productivity, as with prior assessments, is based upon two hypotheses about future recruitment: a ‘high recruitment potential scenario” in which future recruitment has the potential to achieve levels that occurred in the early 1970s and a “low recruitment potential scenario” in which future recruitment is expected to remain near present levels (even if stock size increases). The results of this assessment have shown that long term implications of future biomass are different between the two hypotheses and the issue of identifying one of these two hypotheses, or an alternative one, as being the more realistic remains unresolved. Probabilities of achieving SSB MSY within the Commission rebuilding period were projected for alternative catch levels (Figure 10). The "low recruitment potential scenario" suggests that spawning biomass is currently above SSBMSY, whereas the "high recruitment potential scenario" suggests that SSB MSY has a very low probability of being achieved within the rebuilding period. Despite this large uncertainty about the long term future productivity of the stock, under either recruitment scenario catches of less than 2,250 t are estimated to allow the spawning biomass to be at or above current levels by 2019 (with 50% probability) and this level of catch should not be exceeded. Maintaining catch at current levels (1,750 t) is expected to allow the spawning biomass to increase more quickly, which may help resolve the issue of low and high recruitment potential. Should the Commission decide to have a scientific research quota (such as proposed in SCRS/2013/200, SCRS/2013/203) then that quota should be included within a TAC that is consistent with the scientific advice above. The Committee notes continued stock growth will increase ability to discriminate between alternative recruitment hypotheses. As noted previously by the Committee, both the productivity of western Atlantic bluefin tuna and western Atlantic bluefin tuna fisheries are linked to the eastern Atlantic and Mediterranean stock. Therefore, management actions taken in the eastern Atlantic and Mediterranean are likely to influence the recovery in the western Atlantic, because even small rates of mixing from East to West can have considerable effects on the West due to the fact that eastern plus Mediterranean resource is much larger than that of the West. WESTERN ATLANTIC BLUEFIN TUNA SUMMARY (Catches and Biomass in t) | Current (2013) Catch (including discards) | 1,484 t | Assumed recruitment | Low potential | High potential | Maximum Sustainable Yield (MSY) | 3,050 (2807-3307)1 | 5,316 (4,442-5863)1 | SSBMSY | 13,226 (12,969-13,645)1 | 63,102 (50,096-72,921) | SSB2013/SSBMSY | 2.25 (1.92-2.68)1 | 0.48 (0.35-0.72)1 | FMSY | 0.20 (0.17-0.24)1 | 0.08 (0.07-0.10)1 | F0.1 | 0.12 (0.11-0.13)1 | 0.12 (0.11-0.13)1 | F2010-2012/FMSY2 | 0.36 (0.28-0.43)1 | 0.88(0.64-1.08)1 | F2010-2012/F0.12 | 0.60 (0.50-0.72)1 | 0.60 (0.50-0.72)1 | Stock status | Overfished: NO | Overfished: YES | | Overfishing: NO | Overfishing: NO | Management Measures: | [Rec. 08-04] TAC of 1,900 t in 2009 and 1,800 t in 2010, including dead discards | [Rec. 10-03, 12-02, 13-09] TAC of 1,750 t in 2011-2014, including dead discards. | 1 Median and approximate 80% confidence interval from bootstrapping from the assessment.
2 F 2010-2012 refers to the geometric mean of the estimates for 2010-2012 (a proxy for recent F levels).
Sources “Report of the 2014 Meeting of the Standing Committee on Research and Statistics.” International Commission for the Conservation of Atlantic Tunas (ICCAT). 2015 ICCAT Report for biennial period, 2014-15 PART I (2014) - Vol. 2 ICCAT  https://www.iccat.int/Documents/BienRep/REP_EN_14-15_I-2.pdf https://www.iccat.int/Documents/BienRep/REP_EN_14-15_I-2.pdf |
|
| |
|
|