Northern Bluefin tuna - East Atlantic and Mediterranean Sea|
| Fact Sheet Title Fact Sheet |
| | | Northern Bluefin tuna - East Atlantic and Mediterranean Sea |
 | Northern bluefin tuna in the East Atlantic and Mediterranean Sea |
| | Data Ownership | | This document owned by International Commission for the Conservation of Atlantic Tunas (ICCAT), provided and maintained by Standing Committee on Research and Statistics , is part of ICCAT SCRS Reports data collection. |
| | ident Block | ident Block | | | | Species List: | | Species Ref: en - Atlantic bluefin tuna, fr - Thon rouge de l'Atlantique, es - Atún rojo del Atlántico, ar - تونة حمراء أطلسيَّة, zh - 大西洋蓝鳍金枪鱼 |
|
|
| ident Block Northern Bluefin tuna - East Atlantic and Mediterranean Sea
Map tips
- Click on
 to turn layers on and off to turn layers on and off
- Double-click to zoom in
- Drag to pan
- Hold down the shift key and drag to zoom to a particular region
| iccat Smu |
|---|
| BFT_E | East Atlantic and Mediterranean Sea |
|---|
|
|
|
|
| | Aq Res | Biological Stock: Yes
Value: Regional
Management unit: Yes
Reference year: 2014
|
| Considered a management unit: An aquatic resource or fishery is
declared as [Fishery] Management Unit if it is
effectively the focus for the application of selected
management methods and measures, within the broader
framework of a management system. According to the FAO
Glossary for Responsible Fishing, "a Fishery Management
Unit (FMU) is a fishery or a portion of a fishery
identified in a Fishery Management Plan (FMP) relevant
to the FMP's management objectives." FMU's may be
organised around fisheries biological, geographic,
economic, technical, social or ecological dimensions ,
and the makeup and attribute of a fishery management
unit depends mainly on the FMP's management
objectives. |
| Jurisdictional distribution: Jurisdictional qualifier (e.g.
"shared", "shared - highly migratory") of the aquatic
resource related with its spatial distribution. |
| Environmental group: Classification of the aquatic
resource according to the environmental group (e.g.
pelagic invertebrate, or demersal fish) to which the
species belong. |
| Reference Year: The Reference Year is the last year considered in the stock assessment and/or fishery status. |
| | | | | | History In 2014, the SCRS conducted an update of the 2012 assessment of Atlantic bluefin tuna (Anon. 2013). In this update, the available data included catch, effort and size statistics through 2013. As previously discussed, there are considerable data limitations for the eastern stock up to 2007. While catch data reporting for the eastern and Mediterranean fisheries has substantially improved since 2008 and some historical statistical data have been recovered, none-the-less, most of the data limitations that have plagued previous assessments remain and will require new approaches in order to improve the scientific advice the Committee can offer. The SCRS strongly recommends the continuation of enhanced data collection program and the replacement of current assessment methods with appropriate approaches that take unquantified uncertainties into account.
During the last decade, there has been an overall shift in targeting towards large bluefin tuna, mostly in the Mediterranean. As the majority of these fish are destined for fattening and/or farming operations, it is crucial to get precise information about the total catch, the size composition, the area and flag of capture. Progress has however been made over the last years and therefore the Committee investigated in 2013-2014 the size data retrieved from the observer on board of cages programmes (see SCRS/2013/014). There was considerable quantity of information that were analyzed and compared to current catch at size. These data appeared to be of good quality and the Committee recommended the integration of this new valuable source of information in the Task II database prior to the next stock assessment (work to be completed during the 2015 bluefin tuna data Working Group). Pilot studies using dual camera system or acoustic coupled with video system have been presented at the SCRS since 2010. The results are encouraging and last studies showed that this technique can provide precise catch composition when it is used with a proper and well defined protocol (see SCRS/2013/182; Deguara et al., 2014 ).
The Atlantic-wide Research Program for Bluefin Tuna (GBYP) research plan outlined the research necessary for improving the scientific advice that the Committee provides to the Commission. This plan was presented to and approved by the Commission and the GBYP was started in 2010. The Committee continues to strongly and unanimously support the GBYP, particularly with respect to obtain fisheries-independent indices of stock size, and welcomes the Commission’s continued commitment to the Program. In the absence of such a significant and sustained effort, it remains highly unlikely that the Committee will improve its scientific diagnosis and management advice in the foreseeable future.
In 2012, 2013, and 2014, the SCRS also reviewed new information on the biology, spatial dynamics, catch statistics and fisheries catch rates. The SCRS also discussed progress made by the GBYP and other research program about the aerial survey, tagging, data mining, biological sampling, stock mixing and new modeling approaches (see SCRS/2012/139; Di Natale and Idrissi, 2013 and SCRS/2013/014; Anon. 2014).
Habitat Bio Climatic Zone: Temperate. Vertical Dist: Pelagic.
Atlantic bluefin tuna (BFT) mainly live in the pelagic ecosystem of the entire North Atlantic and its adjacent seas, primarily the Mediterranean Sea. Bluefin tuna have a wide geographical distribution living mostly in temperate Atlantic waters and adjacent seas (Figure 1). Archival tagging and tracking information confirmed that bluefin tuna can sustain cold as well as warm temperatures while maintaining stable internal body temperature. Bluefin tuna preferentially occupy the surface and subsurface waters of the coastal and open-sea areas, but archival tagging and ultrasonic telemetry data indicate that bluefin tuna can frequently dive to depths of more than 1,000 m. Bluefin tuna is also a highly migratory species that seems to display a homing behavior and spawning site fidelity in both the Mediterranean Sea and Gulf of Mexico, which constitute the two main spawning areas being clearly identified today. Less is known about feeding migrations within the Mediterranean and the North Atlantic, but results from electronic tagging indicated that bluefin tuna movement patterns vary considerably between individuals, years and areas. The appearance and disappearance of important past fisheries further suggest that important changes in the spatial dynamics of bluefin tuna may also have resulted from interactions between biological factors, environmental variations and fishing. Although the Atlantic bluefin tuna population is managed as two stocks, conventionally separated by the 45°W meridian, its population structure remains poorly understood and needs to be further investigated. Recent genetic and microchemistry studies as well as work based on historical fisheries tend to indicate that the bluefin tuna population structure is complex.
Currently, the SCRS assumes that eastern Atlantic and Mediterranean bluefin tuna mature at approximately 25 kg (age 4) and western Atlantic bluefin tuna at approximately 145 kg (age 9). Recent information received by the SCRS indicated that some individuals caught in the West Atlantic as small as 47 kg (age 5) were mature. Juvenile and adult bluefin tuna are opportunistic feeders (as are most predators). However, in general, juveniles feed on crustaceans, fish and cephalopods, while adults primarily feed on fish such as herring, anchovy, sand lance, sardine, sprat, bluefish and mackerel. Juvenile growth is rapid for a teleost fish, but slower than other tuna and billfish species. Fish born in June attain a length of about 30-40 cm long and a weight of about 1 kg by October. After one year, fish reach about 4 kg and 60 cm long. At 10 years old, a bluefin tuna is about 200 cm and 170 kg and reaches about 270 cm and 400 kg at 20 years. Bluefin tuna is a long-lived species, with a lifespan of about 40 years, as indicated by recent studies from radiocarbon deposition.
The Committee evaluated information from the bluefin meeting on biological parameters hold in 2013 and bluefin species group meetings in 2014 (SCRS/2013/014; SCI-030; 2014 bluefin tuna assessment detailed report). New contributions have been presented from GBYP and national research projects on reproduction, direct age estimations, population structure, spawning areas and larval studies.
New modeling has been conducted using a comprehensive dataset that facilitates length weight-length relationships to reflect the timing and area of spawning which the Committee feels adequate for assessment modeling and are adopted. While further analyses have to be performed to improve the adopted relationship, future assessment will rely on these relationships. Sensitivity analyses will be carried out to analyze the impact of these new relationships on the stock assessment. Substantial progress has been made in estimating regional mixing levels for Atlantic bluefin tuna from otolith stable isotope analysis. Research on larval ecology of Atlantic bluefin tuna has advanced in recent years through oceanographic habitat suitability models. Direct age estimations have been calibrated between readers from several institutions.
An important electronic and conventional tagging activity on both juveniles and adults fish has been performed in the East Atlantic and Mediterranean by GBYP, national programmes and NGOs. These ongoing efforts have started to provide significant insight into bluefin tuna stock structure, mixing and migrations and would possibly help in estimating fishing mortality rates.
The Committee recognized that there have been important recent contributions to the understanding of bluefin tuna biology and ecology that should have significant impacts on the assessment of the resource.
Geo Dist Geo Dist: Highly migratory Bluefin tuna have a wide geographical distribution living mostly in temperate Atlantic waters and adjacent seas (Figure 1). Water Area Overview  | | Water Area Overview Northern Bluefin tuna - East Atlantic and Mediterranean Sea
| iccat Smu | BFT_E: East Atlantic and Mediterranean Sea |
| | | | | | Water Area Overview |
Water Area OverviewNorthern Bluefin tuna - East Atlantic and Mediterranean Sea Aq Res Struct Biological Stock: Yes
Bluefin tuna is also a highly migratory species that seems to display a homing behavior and spawning site fidelity in both the Mediterranean Sea and Gulf of Mexico, which constitute the two main spawning areas being clearly identified today. Less is known about feeding migrations within the Mediterranean and the North Atlantic, but results from electronic tagging indicated that bluefin tuna movement patterns vary considerably between individuals, years and areas. The appearance and disappearance of important past fisheries further suggest that important changes in the spatial dynamics of bluefin tuna may also have resulted from interactions between biological factors, environmental variations and fishing. Although the Atlantic bluefin tuna population is managed as two stocks, conventionally separated by the 45°W meridian, its population structure remains poorly understood and needs to be further investigated. Recent genetic and microchemistry studies as well as work based on historical fisheries tend to indicate that the bluefin tuna population structure is complex.
The Committee evaluated information from the bluefin meeting on biological parameters hold in 2013 and bluefin species group meetings in 2014 (SCRS/2013/014; SCI-030; 2014 bluefin tuna assessment detailed report). New contributions have been presented from GBYP and national research projects on reproduction, direct age estimations, population structure, spawning areas and larval studies.
Substantial progress has been achieved by the GBYP “Biological Sampling and Analysis” program in relation to stock structure (genetics and microconstituents) and direct age estimations.
An important electronic and conventional tagging activity on both juveniles and adults fish has been performed in the East Atlantic and Mediterranean by GBYP, national programmes and NGOs. These ongoing efforts have started to provide significant insight into bluefin tuna stock structure, mixing and migrations and would possibly help in estimating fishing mortality rates.
Substantial progress has been made in estimating regional mixing levels for Atlantic bluefin tuna from otolith stable isotope analysis
The Committee recognized that there have been important recent contributions to the understanding of bluefin tuna biology and ecology that should have significant impacts on the assessment of the resource.
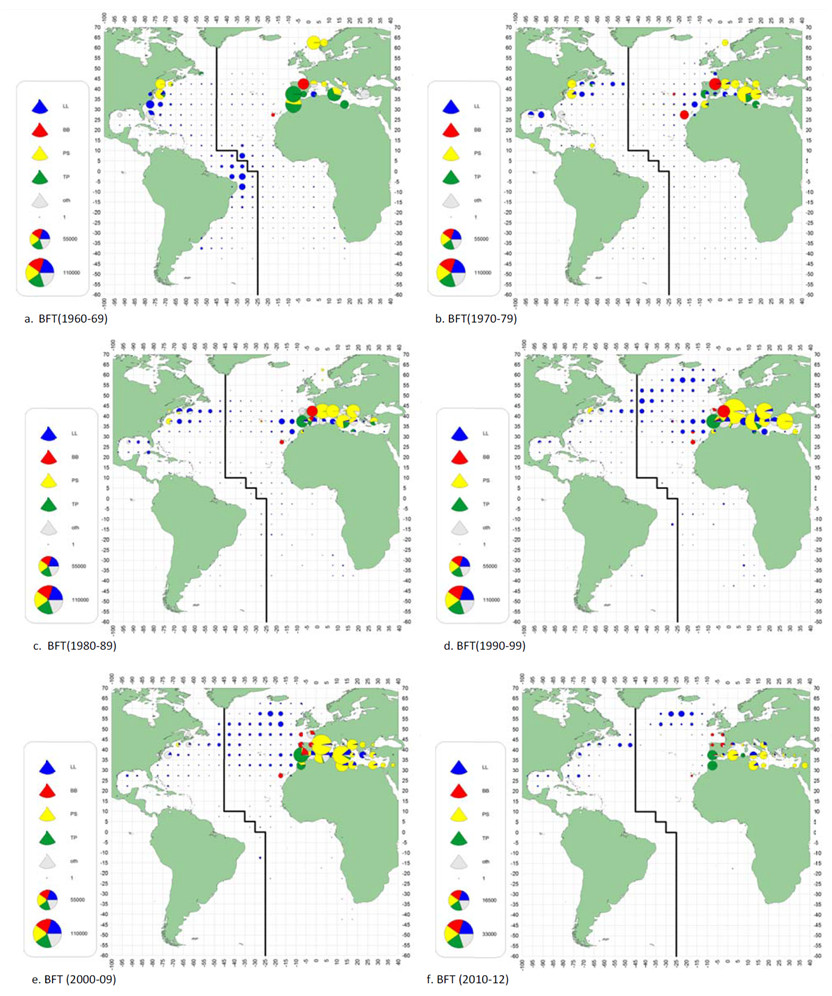 | Figure1 Geographic distribution of bluefin tuna catches per 5x5 degrees and per main gears from 1950 to 2012.  |
Exploit Fishery indicatorsIt is very well known that introduction of fattening and farming activities into the Mediterranean in 1997 and good market conditions resulted in rapid changes in the Mediterranean fisheries for bluefin tuna mainly due to increasing purse seine catches. In the last few years, nearly all of the declared Mediterranean bluefin fishery production was exported overseas. Declared catches in the East Atlantic and Mediterranean reached a peak of over 50,000 t in 1996 and then decreased substantially, stabilizing around TAC levels established by ICCAT for the most recent period (Figure 2). Both the increase and the subsequent decrease in declared production occurred mainly for the Mediterranean (Figure 2). Since 2008, there was a significant decrease in the reported catch following more restrictive TACs. Declared catch was, as used in the assessment (with minor updates for 2012 and 2013 at the time of the meeting), 23,849 t, 19,751 t, 11,148 t, 9,774 t, 10,852 t, and 13,133 t for the East Atlantic and Mediterranean, of which 16,205 t, 13,066 t, 6,835 t, 5,790 t, 7,019 t, and 9,016 t were declared for the Mediterranean for those same years ( Table1 ).
Information available has demonstrated that catches of bluefin tuna from the East Atlantic and Mediterranean were seriously under-reported between the mid 1990s through 2007. The Committee views this lack of compliance with TAC and under-reporting of the catch as a major cause of stock decline over that period. The Committee has estimated that realized catches during this period could have been in the order of 50,000 t to 61,000 t per year based on the number of vessels operating in the Mediterranean Sea and their respective catch rates. Estimates for 2008 and 2009 using updated vessel capacity and performance statistics from the various reports submitted to ICCAT under [Rec. 08-05] result in estimates that are significantly lower than the corresponding reported Task I data (see the 2010 ICCAT Data Preparatory Meeting on Bluefin Tuna) (Anon. 2011c). Although care is needed considering estimates of catch using these capacity measures, the Committee's interpretation is that a substantial decrease in the catch occurred in the eastern Atlantic and Mediterranean Sea in 2008 and 2009.
Recent regulatory measures have affected significantly all the CPUE indices through the change of operational pattern, length of the fishing season and target sizes. Recent tendency in the indicators are likely a reflection of positive outcomes from recent management measures. Fisheries-independent indicators (e.g. aerial and larval surveys) and a large-scale tagging program are nonetheless needed to provide more reliable stock status indicators. It is also noteworthy that no abundance indices from the Mediterranean part of the stock are used for the stock assessment.
Available indicators from the Bay of Biscay baitboat fisheries (small and medium fish) shows a general increasing trend over the whole time period, with more variable values after the mid 80s, with two peaks in the 90s and one in the mid 2000s (Figure 3). This CPUE index covers the longest period (1952-2013), during which changes in selectivity took place, especially during the most recent periods because of changes in management regulations. The Spanish baitboat fishery sold most of its quota to other Spanish fisheries in 2012 and 2013. This CPUE index now includes the French baitboat fishery data and has been standardized and updated accordingly.
Indicators from Moroccan and Spanish traps targeting large fish (spawners) are standardized catch per unit of effort (CPUE) up to 2012 and include released individuals, which represent more than 10,000 individuals in 2012. The Moroccan trap index was further updated up to 2014 including 25,000 released individuals during that year. CPUE of Moroccan and Spanish traps showed a substantial increasing trend over the last years and large fluctuations, with period of high catch rates, as in the early 1980s, late 1990s and late 2000s and periods of lower catch rates, as in the mid 1990s and mid 2000s (Figure 3). However, in 2013, the access to Spanish trap facilities has not been allowed to scientific observers and no data are available to ensure the continuity of this time-series. The Committee strongly requires to ensure the access to Spanish traps for coming years.
Indicators from Japanese longliners targeting large fish (spawners) in the East Atlantic (South of 40ºN) and the Mediterranean Sea displayed a recent increase after a general decline since the mid 1970s (Figure 3). However, this index has not been updated since 2009 because this fleet did not operate in the Mediterranean and rarely in the East Atlantic (South of 40ºN) in recent years. Indicators from Japanese longliners targeting medium to large fish in the northeast Atlantic were available since 1990 and has been updated to 2013. This index showed a strong increasing trend over the last 3 years (Figure 3). This index becomes more valuable since the major part of Japanese catch come from this fishing ground in recent years. The size of bluefin caught in this area showed a large contribution of the 2003 year class. The combined effects of this high proportion of the 2003 year class, the contraction of the spatial coverage of the Japanese longliners in recent years in response to a lower number of boats, and management regulations may affect the ability of this index to track changes in bluefin tuna abundance. However, the method used to standardize this index does not show irregularities and the continuity of this index seems to be ensured.
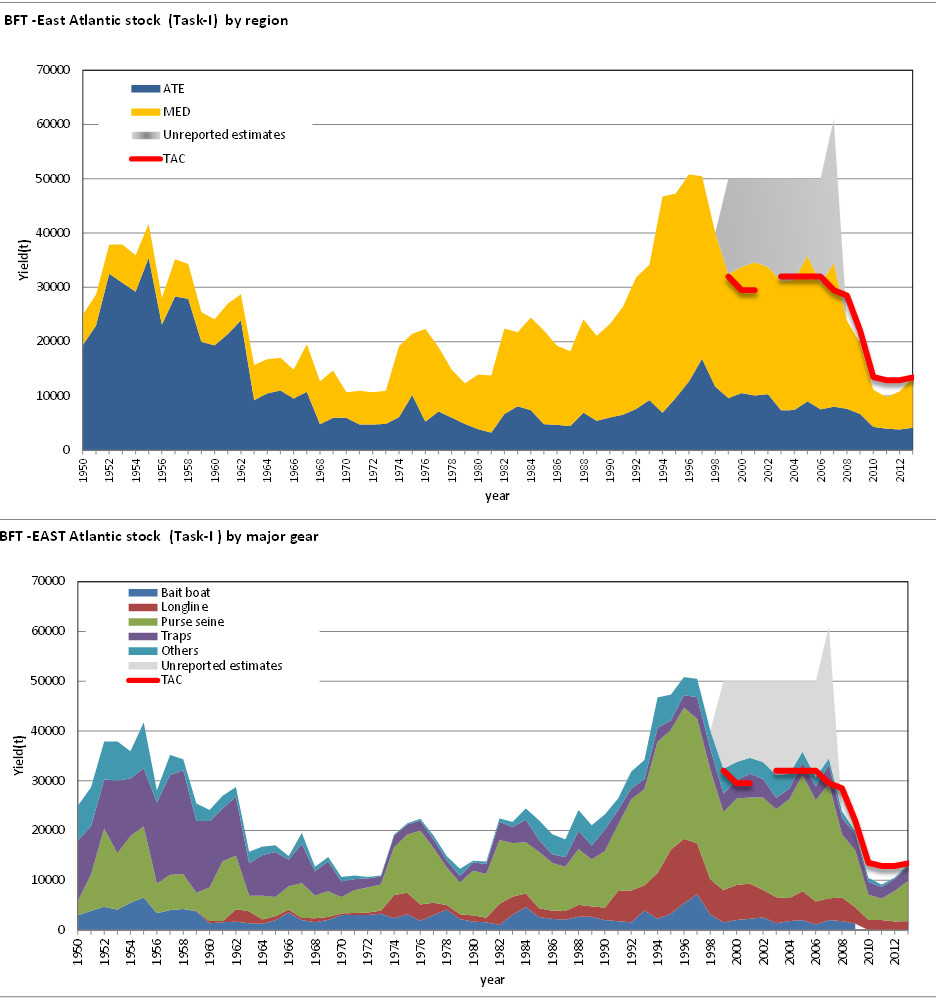 | | Figure 2 Reported catch for the East Atlantic and Mediterranean from Task I data from 1950 to 2013 split by main geographic areas (top panel) and by gears (bottom panel) together with unreported catch estimated by the SCRS (using fishing capacity information and mean catch rates over the last decade) from 1998 to 2007 (the SCRS did not detect unreported catch using fishing capacity information since 2008) and TAC levels since 1998. |
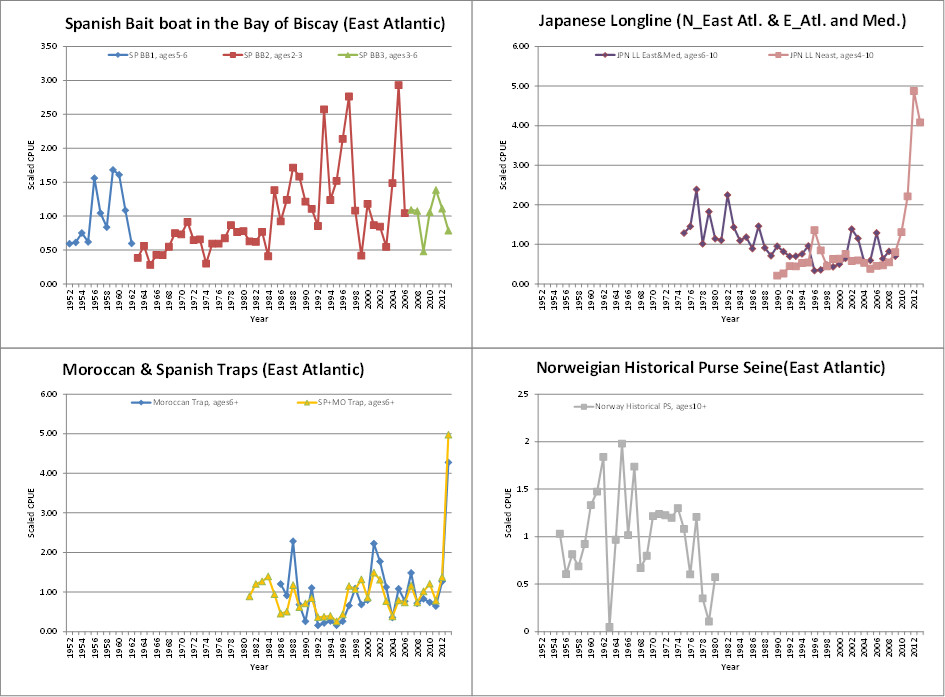 | | Figure 3 Plots of the CPUE time series fishery indicators for the East Atlantic and Mediterranean bluefin tuna stock used in the 2014 stock assessment. All CPUE series are standardized series except the nominal Norway PS index. The Spanish BB series (top left panel) was split in three series to account for changes in selectivity patterns, and the latest series was updated until 2013 using both French and Spanish BB data due to the sale of the quota by the Spanish fleet. The Moroccan-Spanish traps CPUE and the Japanese Longlines CPUE for the Northeast Atlantic have been updated until 2013. The Moroccan CPUE was used only for the sensitivity analysis. |
Bio Assess Assess Models The quality and the representativeness of catch statistics is the most crucial element of the bluefin tuna stock assessment. In spite of recent improvements in the data quantity and quality for the past few years, there remain important data limitations for the 2014 updated assessment of the stock (Anon. 2014d). These included poor temporal and spatial coverage for detailed size and catch-effort statistics for several fisheries, especially in the Mediterranean. Substantial under-reporting of total catches was also evident between 1998 and 2007. Nevertheless, the Committee updated the 2012 stock assessment (Anon. 2012) as requested by the Commission, applying the same methodologies and hypotheses adopted by the Committee in 2012. The pilot assessment using new historical and recent information about catch was not fully evaluated due to time constraints, instead, a comparison of the Continuity run using these new data have been carried out and results are only presented in the detailed reports (section 6.1.1 and Figures 12-14 of SCRS-2014-113). The Committee believes that while substantial improvements in catch and effort statistics are necessary in the future for more robust stock assessment, it appears unlikely that such substantial improvements can be made regarding historical fishery performance.
The updated assessment results indicated that the spawning stock biomass (SSB) peaked over 300,000 t in the late 1950s and early 1970s and then declined to about 150,000 t until the mid 2000s. In the most recent period, the SSB showed clear signs of sharp increase in all the runs that have been investigated by the Committee, up to almost 585,000 t in 2013 for the update of the 2012 Base Case which corresponds to the maximum estimated SSB over the period (see Bluefin Tuna Detailed Report, Figure 4). However, the magnitude and the speed of the SSB increase vary substantially among the runs (an SSB between 439,000 t and 647,000 t in 2013) and are, therefore, still rather uncertain (see detailed report, section 6). This increase corresponds to a 4-fold increase in SSB over the past decade and ranges from 3 to 4.5-fold across the sensitivities examined. Trends in fishing mortality (F) for the younger ages (ages 2-5) displayed a continuous increase until recent years. Since 2008, F at ages 2-5 decreased sharply to reach the lowest historical values. For oldest fish (ages 10+), F had been decreasing during the first 2 decades and then rapidly increased since the 1980s and finally declined since the late 2000s (Figure 4). These recent trends in F are consistent with those obtained during the 2012 stock assessment. For the 1995-2007 years, Fs for older fish are also consistent with a shift in targeting towards larger individuals destined for fattening and/or farming. Recent recruitment levels remain uncertain due to limited information about incoming year class strength and uncertainties in the indicators used to track recruitment. While the reduction in catch less than the minimum size improves the yield per recruit, it makes recent recruitments more difficult to estimate, especially without a recruitment index. The Committee noted that this is the first assessment to estimate extraordinarily large year classes in 2004-2007 (over 40% higher than the highest observed recruitments in the rest of the 64 year time series), and that these high estimates are driven mostly by the recent trends in the two fishery dependent indices for older fish. Therefore, caution is warranted until the very high estimates of recruitment for these year classes can be confirmed.
Estimates of current stock status relative to MSY benchmarks are highly sensitive to the selectivity pattern (and thus to some technical assumptions in the VPA) and, for the biomass reference point, to the hypotheses about the recruitment levels. In addition to those uncertainties, the current perception of the stock status is also closely related to the assumptions made about stock structure and migratory behavior, which remain poorly known. Nonetheless, the perception of the stock status derived from the 2014 updated assessment has improved in comparison to previous assessments, as F for both younger and older fish have declined during the recent years. All the runs investigated by the Committee also showed a clear increase of the SSB. F 2013 appears to clearly be below the reference target F 0.1 (a reference point used as a proxy for F MSY that is more robust to uncertainties than F MAX ) in both catch scenarios: F 2013 /F 0.1 = 0.4 and 0.36 for the reported and inflated catch scenarios, respectively. If F 2013 would be consistent with the Convention Objectives, current SSB is most likely to be above the level expected at F 0.1 : SSB 2013 /SSB 0.1 = 1.10 and 1.11 for reported and inflated catch scenario when considering medium recruitment. In the reported catch scenario, the median of the SSB is about 67% (high recruitment scenario) to 160% (low recruitment scenario) of the biomass that is expected under a F 0.1 strategy. In the inflated catch scenario, the median SSB ranges from 55% (high recruitment) to 174% (low recruitment, Figures 5 and 6).
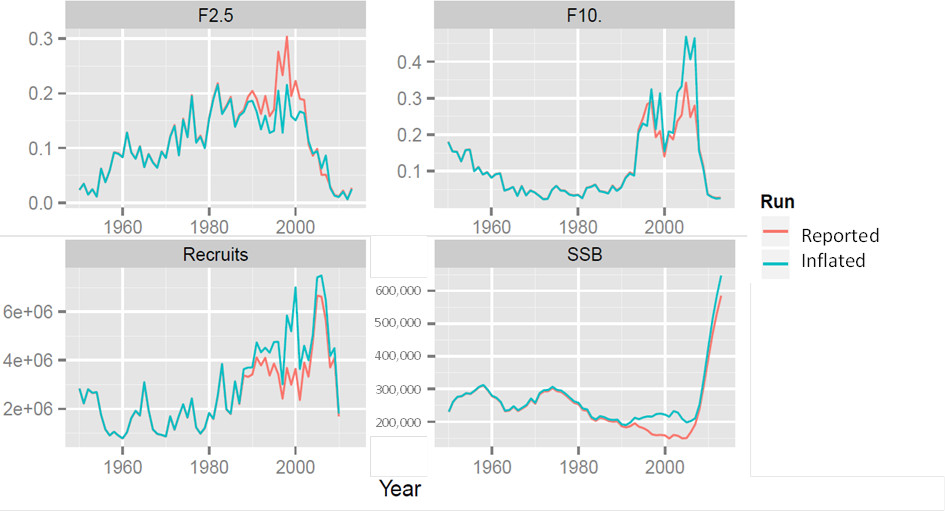 | | Figure 4 Fishing mortality (for ages 2 to 5 and 10+), spawning stock biomass (in metric ton) and recruitment (in number of fish) estimates from VPA continuity run (considered as the base case in the 2014 stock assessment). Red line: reported catch; blue line: inflated (from 1998 to 2007) catch. |
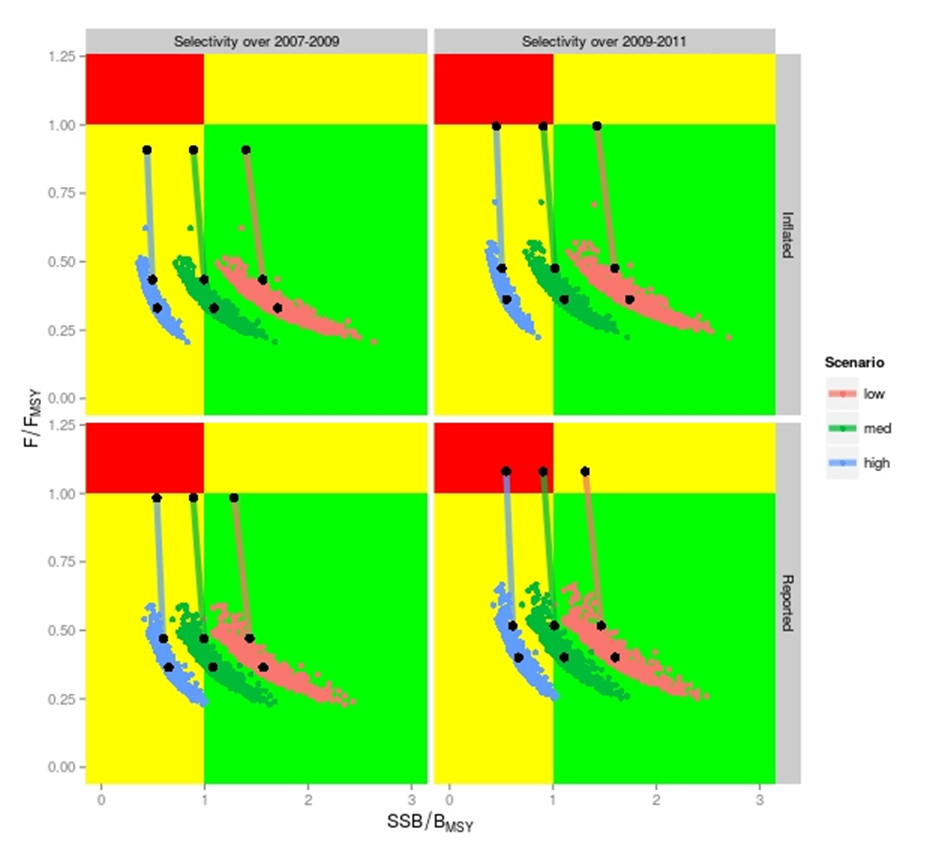 | | Figure 5 Stock status from 2011 to the terminal year (2013) estimated from VPA continuity run with reported and inflated catch (upper and lower panels) and considering low, medium and high recruitment levels (blue, green and red lines). Blue, green and red dots represent the distribution of the terminal year obtained through bootstrapping for the corresponding three recruitment levels. Left Panel (selectivity over 2007-2009): 2013 SSB and F relative to reference points calculated with the selectivity pattern over 2007-2009 which was same period as the 2010 stock assessment. Right Panel (selectivity over 2009-2011): 2013 SSB and F relative to the reference points with the selectivity pattern over 2009-2011 which was same period as the 2012 stock assessment. |
 | | Figure 6 Pie chart showing the proportion of the VPA continuity run results for the terminal year (2013) that are within the green quadrant of the Kobe plot chart (not overfished, no overfishing), the yellow quadrant (overfished or overfishing), and the red quadrant (overfished and overfishing). Split by catch scenario (reported and inflated) and benchmark (selectivity patterns were estimated over 2007-2009 or over 2009-2011). |
Results OutlookIn 2014, the Committee performed a set of projections using similar technical specifications as in 2012, i.e. using three mean recruitment levels and two catch scenarios (reported and inflated) and the same periods to calculate the selectivity patterns as in 2012 (computed as the geometric means over the 2007-2009 and 2009-2011 partial Fs, see (Kell et al., 2013 for more details). According to the 2014 VPA results and above specifications, F would remain below F 0.1 in the 10 coming years with at least 60% of probabilities for all catch levels investigated, and the probability to achieve SSBF 0.1 (i.e. the equilibrium SSB resulting in fishing at F 0.1 ) by the end of 2022, with at least 60% of probabilities, is also reached (Figures 7 and 8)
Projections are known to be impaired by various sources of uncertainties that have not yet been fully quantified. One of these is that the Kobe matrix was only calculated for the Continuity run in the time available. Although the situation has improved regarding recent catch, there are still uncertainties about the speed and magnitude of the SSB increase (see the slope of Figure 4), key modeling parameters for bluefin tuna productivity, the current and future recruitment levels, the stock structure within the Mediterranean and eastern Atlantic stock and the level of IUU catch (although it is clear to the Committee that the level of IUU has strongly decreased since 2008). Some of these uncertainties, as those reflected above, have not been taken into account in the Kobe matrices. Acknowledging these limitations, the 2014 updated stock assessment indicates that the rebuilding of eastern bluefin tuna at SSBF 0.1 level with a probability of at least 60% could be achieved before 2022 with the different TACs examined (up to 30,000 t, Figure 9). While the updated fisheries indicators are consistent with the estimation of stock rebuilding, there still remain key uncertainties regarding current and future recruitment levels and the speed and magnitude of the rebuilding of the SSB. The results from the projections thus need to be further confirmed by future data and analyses.
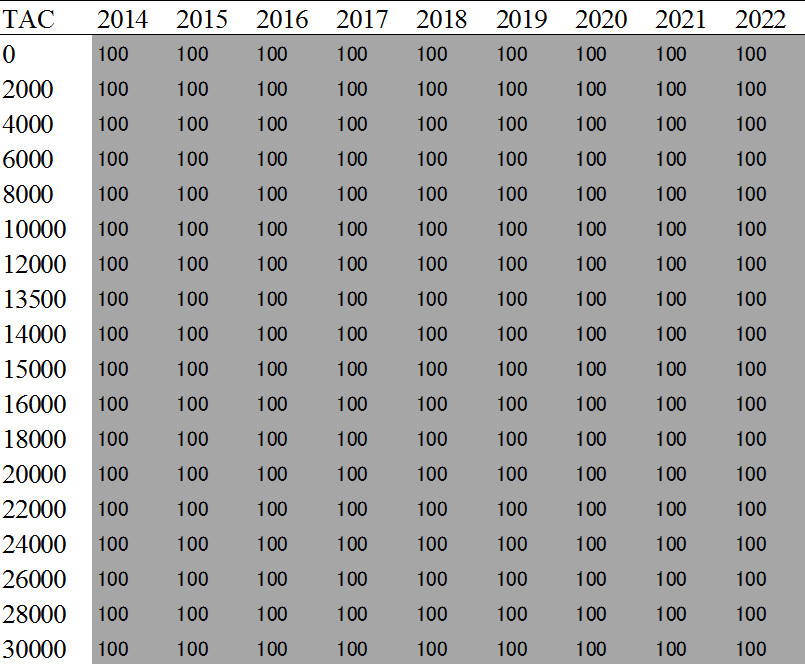 | | Figure 7 Kobe II matrices (updated during the 2014 stock assessment) giving the probability that the spawning stock biomass will exceed the level that will produce MSY (SSB>SSBMSY, not overfished) in any given year for various constant catch levels under the low recruitment and high recruitment scenarios. The current TAC of 1,750 t [Rec. 13-09] is indicated in bold. |
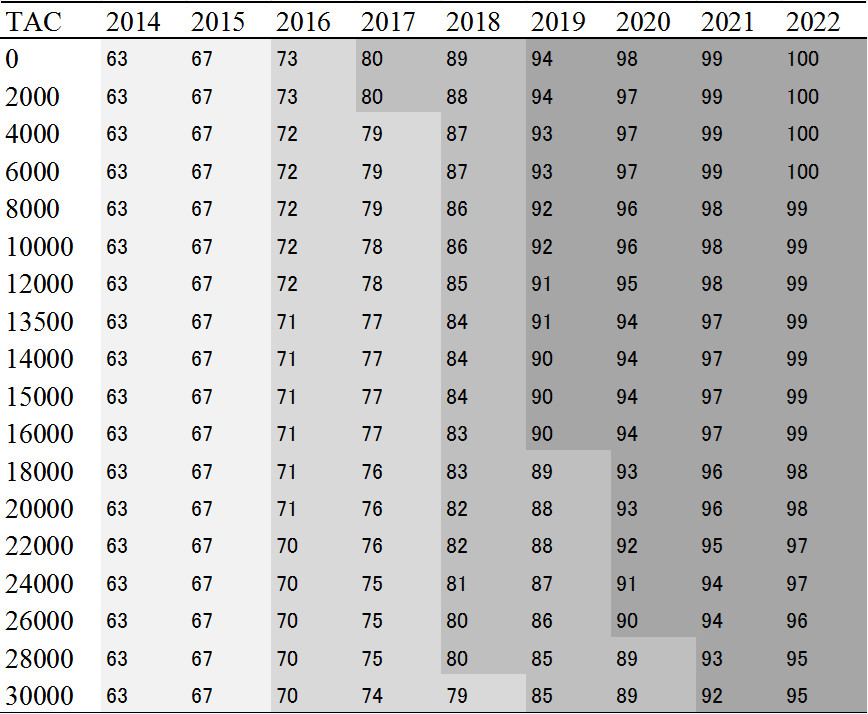 | | Figure 8 Kobe II matrices (updated during the 2014 stock assessment) giving the probability that the fishing mortality rate (F) will be less than the level that will produce MSY (F<FMSY, no overfishing) in any given year for various constant catch levels under the low recruitment and high recruitment scenarios. The current TAC of 1,750 t [Rec. 13-09] is indicated in bold. |
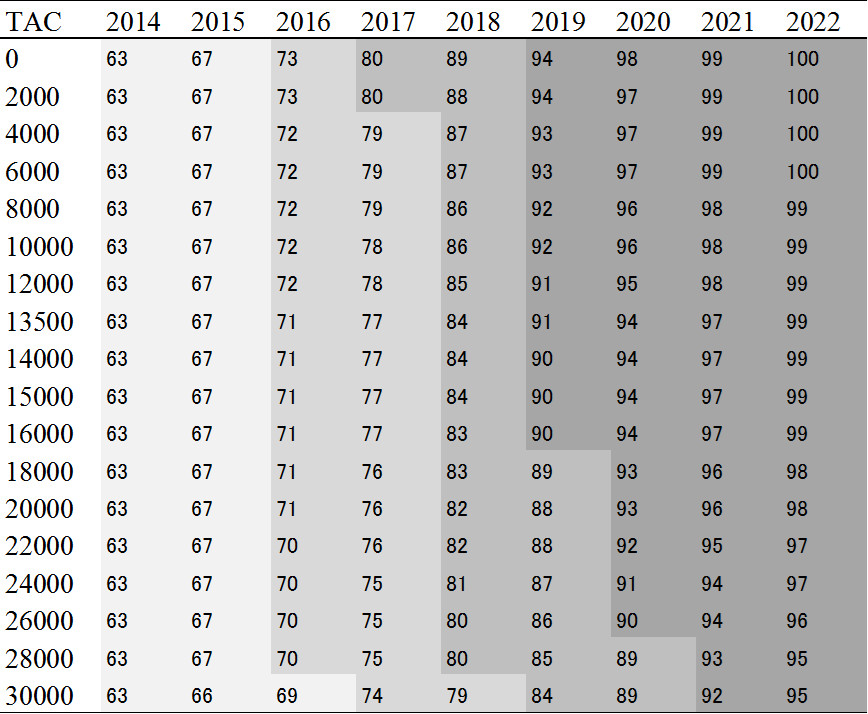 | | Figure 9 Kobe II matrices (updated during the 2014 stock assessment) giving the joint probability that the fishing mortality rate will be less than the level that will produce MSY (F<FMSY) and the spawning stock biomass (SSB) will exceed the level that will produce MSY (B>BMSY) in any given year for various constant catch levels under the low recruitment and high recruitment scenarios. The current TAC of 1,750 t [Rec. 13-09] is indicated in bold. |
Management Management unit: Yes Effects of current regulations
Catch limits have been in place for the eastern Atlantic and Mediterranean management unit since 1998. In 2002, the Commission fixed the Total Allowable Catch (TAC) for the eastern Atlantic and Mediterranean bluefin tuna at 32,000 t for the years 2003 to 2006 [Rec. 02-08] and at 29,500 t and 28,500 t for 2007 and 2008, respectively [Rec. 06-05]. Subsequently, [Rec. 08-05] established TACs for 2009, 2010, and 2011 at 22,000 t, 19,950 t, and 18,500 t, respectively. However, the 2010 TAC was revised to 13,500 t by [Rec. 09-06], which also established a framework to set future (2011 and beyond) TACs at levels sufficient to rebuild the stock to BMSY by 2022 with at least 60% probability. The 2011, 2012, and 2013 TACs were set at 12,900 t, 12,900 t, and 13,500 t respectively by [Rec. 10-04 and Rec. 12-03], and of 13,500t that of 2014 [Rec. 13-07].
The reported catches for 2003, 2004 and 2006 were about TAC levels, but those for 2005 (35,845 t) and 2007 (34,516 t) were notably higher than TAC. However, the Committee strongly believes, based on the knowledge of the fishing capacity, that substantial under-reporting was occurring and that actual catches up to 2007 were well above TAC. The SCRS estimates since the late 1990s, catches were close to the levels reported in the mid 1990s, but for 2007, the estimates were higher i.e. about 61,000 t in 2007 for both the East Atlantic and Mediterranean Sea. As noted, reported catch levels for 2008 (23,849 t), 2009 (19,751 t), 2010 (11,148 t), 2011 (9,774 t), 2012 (10,852 t), and 2013 (13,133 t) appear to largely reflect the removals from the stock when comparing estimates of catch using vessel capacity measures, although the utility of this method has diminished for estimating catch (Table 1, Figure 2). Although care is needed when considering estimates of catch using capacity measures, the Group’s interpretation is that a substantial decrease in the catch occurred in the eastern Atlantic and Mediterranean Sea through implementation of the rebuilding plan and through monitoring and enforcement controls. While current controls appear sufficient to constrain the fleet to harvests at or below TAC, the Committee has not assessed the current fishing capacity and remains concerned about current capacity which could easily harvest catch volumes well in excess of the rebuilding strategy adopted by the Commission.
Recent analyses from the reported catch-at-size and catch-at-age displayed important changes in selectivity patterns over the last years for several fleets operating in the Mediterranean Sea or the East Atlantic. This partly results from the enforcement of minimum size regulations under Rec. [06-05], which led to much lower reported catch of younger fish and subsequently a significant increase in the annual mean-weight in the catch-at-size since 2007 (Figure 10). Additionally, higher abundance or higher concentration of small bluefin tuna in the north-western Mediterranean detected from aerial surveys could also reflect positive outcomes from increase minimum size regulation. Rec. [06-05] also resulted in improved yield-per-recruit levels in comparison to the early 2000s as well as to a greater recruitment to the spawning stock biomass due to higher survival of juvenile fish.
An important source of uncertainty originated from the reduction in TAC and the unexpected high level of strong year class, which has strongly affected all the index calculations for different reasons (see detailed report). The difficulties to update the Spanish baitboat, Spanish trap and Japanese indices in 2013 could be highly problematic for the coming years, as those indices are crucial for stock assessment. It also worth noting that the transfer of quotas from one fisheries to another may also affect stock assessment outcomes, as such transfers have implications for the repartition of the fishing effort and thus for selectivity patterns, which are known to impact the references points. Therefore, the Committee reiterates the importance to continue effort, through national programs and GBYP, to improve the quality of currently used abundance indices and obtain robust fisheries-independent indicators. It notes however that necessary decisions regarding management of the stock have often the side effect of adding uncertainties to stock assessment, e.g., by changing fleet behavior and fisheries selection pattern.
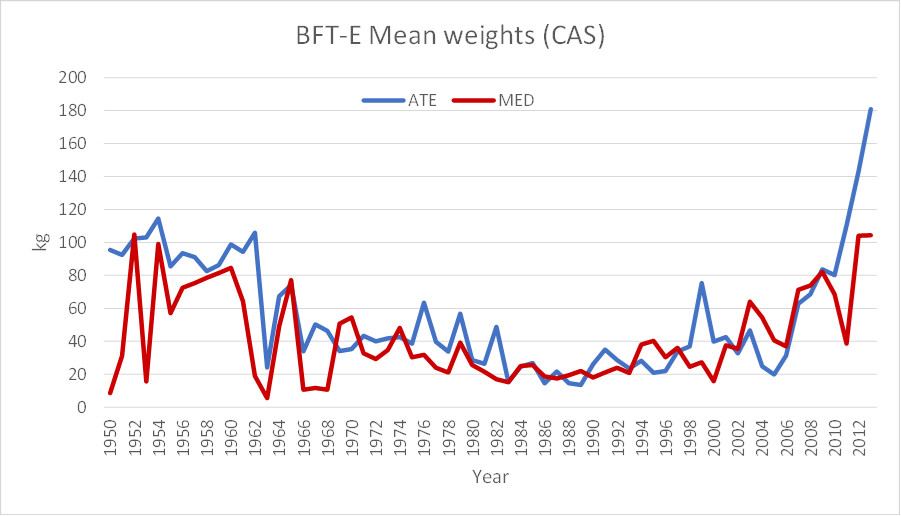 | | Figure 10 Estimated status of stock relative to the Convention objectives (MSY) by year (1973 to 2013) and recruitment scenario (light blue=high recruitment potential, dark blue=low recruitment potential). The light gray dots represent the status estimated for 2013 under the low recruitment scenario, corresponding to bootstrap estimates of uncertainty. The dark blue lines give the historical point estimates for the low recruitment, and the light blue gives the historic trend for the high recruitment. |
Advice In [Res. 09-06, 10-04, 12-03, and 13-07] the Commission established a total allowable catch for eastern Atlantic and Mediterranean bluefin tuna between 12,900 t and 13,500 t since 2010. Additionally, in [Rec. 09-06] the Commission required that the SCRS provide the scientific basis for the Commission to establish a recovery plan with the goal of achieving B MSY through 2022 with at least 60% of probability.
The Kobe matrices are presented indicating the probabilities of i) F<F MSY (Table 1) ii) SSB>SSB MSY(Table 2) and iii) (F<F MSY and SSB>SSB MSY (Table 3) for quotas from 0 to 30,000 t for 2014 through 2022. Shading corresponds to the probabilities of being in the ranges of 50-59%, 60- 69%, 70-79%, 80-89% and greater or equal to 90%. It should be kept in mind, however, that the Kobe matrices cannot integrate some important sources of uncertainties that currently remain unquantified as mentioned in section 4 and detailed report.
The implementation of recent regulations through [Recs. 13-07, 12-03, 10-04, 09-06, and previous recommendations] has clearly resulted in reductions in catch and fishing mortality rates, and in a substantial increase in the spawning stock biomass for the Continuity run and the 7 sensitivity analyses of the updated assessment. All CPUE indices show increasing trends in the most recent years. However, the Committee notes that the present assessment is an update of the 2012 assessment which relies only on a Continuity model and 7 sensitivity analyses. This update showed lack of the stability of VPA results to slight changes in data inputs and model specifications
In the light of the results of the updated assessment, there are continuing positive signs of the success of the rebuilding plan and the efficiency of the management measures taken by the Commission. Noting that the goal of achieving Bmsy (through 2022) with at least 60% probability might already have been, or will soon be reached, the Commission should consider adding a new phase to the current recovery plan.
The Committee noted that maintaining current TAC or moderately and gradually increasing over recent TACs under the current management scheme should not undermine the success of the rebuilding plan and should be consistent with the goal of achieving FMSY and BMSY through 2022 with at least 60% of probability. However, as the Committee was not able to provide the Commission with a robust advice on an upper bound for the TAC because of differing views about the implications of the uncertainties associated with the assessment, no agreement could be reached about the upper limit for such an increase that would not jeopardize the recovery of the stock. In equivalent situations, other scientific fora have similarly recommended moderate increases of the TAC, in applying the precautionary approach. To this end, and among other possible targets (e.g. F0.1, Fmax, etc.), a gradual increase (in steps over e.g. 2 or 3 years) of the catch to the level of the most precautionary MSY estimate would allow the population to increase even in the most conservative scenario (low recruitment scenario), noting the Commission’s desire to maintain the stock in the green zone [13-07]. Nevertheless the SCRS scientists were not able to reach a consensus on the number of steps to complete the rebuilding plan, or on the management strategies.
Such stepped increases should be reviewed annually by the Commission on the advice of the SCRS (such reviews should consider stock indicators but would not necessarily extend to update stock assessment).
EAST ATLANTIC AND MEDITERRANEAN BLUEFIN TUNA SUMMARY |
Current reported yield (2013) |
13,333 t |
|
Reported catch |
Inflated catch |
Maximum Sustainable Yield1
Low recruitment scenario (1970s)
Medium recruitment scenario (1950-2006)
High recruitment scenario (1990s) |
23,256 t
33,662 t
55,860 t |
23,473 t
36,835 t
74,248 t |
F0.12,3 |
0.07 yr-1 |
0.07 yr-1 |
F2013/F0.1 |
0.40 |
0.36 |
SSBF0.1
Low recruitment scenario (1970s)
Medium recruitment scenario (1950-2006)
High recruitment scenario (1990s) |
351,500 t
508,700 t
843,800 t |
354,600 t
556,600 t
1,121,000 t |
SSB2013/SSBF0.1
Low recruitment scenario (1970s)
Medium recruitment scenario (1950-2006)
High recruitment scenario (1990s) |
1.60
1.10
0.67 |
1.74
1.11
0.55 |
TAC (2010 - 2014) |
13,500 t - 12,900 - 12,900 t - 13, 500 t - 13, 500 t |
|
1 Approximated as the average of the potential long-term yield that is expected at a F0.1 strategy. The levels of these yields have been computed using the selectivity pattern over 2009-2011 and can substantially change according to different selectivity patterns.
2 The Committee decided, on the basis of current published literature, to adopt F0.1 as the proxy for FMSY. F0.1 has been indeed shown to be more robust to uncertainty about the true dynamics of the stock and observation errors than FMAX. Values are given for both reported and inflated catch scenarios, respectively. F0.1 have been also computed using the 2012 selectivity pattern and can thus substantially change according to different selectivity patterns.
3 The recruitment levels do not impact F0.1.
Sources “Report of the 2014 Meeting of the Standing Committee on Research and Statistics.” International Commission for the Conservation of Atlantic Tunas (ICCAT). 2015 ICCAT Report for biennial period, 2014-15 PART I (2014) - Vol. 2 ICCAT  http://www.iccat.int/Documents/Meetings/SCRS2012/2014_SCRS_REP_EN.pdf http://www.iccat.int/Documents/Meetings/SCRS2012/2014_SCRS_REP_EN.pdf |
|
| |
|
|