European Union Mediterranean and Black Sea fishing fleet|
| | | European Union Mediterranean and Black Sea fishing fleet |
| | Data Ownership | | This document provided, maintained and owned by Directorate-General for Maritime Affairs and Fisheries - European Commission , is part of STECF - Annual Economic Report on the EU Fishing Fleet data collection. |
|
Overview: EU Member States fishing in Mediterranean waters include Spain, France, Italy, Slovenia, Greece, Malta, Cyprus and Portugal. Bulgaria and Romania fish exclusively in the Black sea.
|
| Means of Production Type of production system: Industrial Land Area EU Member States fishing in Mediterranean waters include Spain, France, Italy, Slovenia, Greece, Malta, Cyprus and Portugal. Bulgaria and Romania fish exclusively in the Black sea. Land Area References for: EU Member States fishing in Mediterranean waters  EU Member States fishing in Mediterranean waters| ISO3 Code | BGR - Bulgaria | | CYP - Cyprus | | FRA - France | | GRC - Greece | | ITA - Italy | | MLT - Malta | | PRT - Portugal | | ROU - Romania | | SVN - Slovenia | | ESP - Spain | | UN | 100 - Bulgaria | | 196 - Cyprus | | 250 - France | | 300 - Greece | | 380 - Italy | | 470 - Malta | | 620 - Portugal | | 642 - Romania | | 705 - Slovenia | | 724 - Spain |
Fishery Area Mediterranean and Black Sea Geo References for: Mediterranean and Black Sea
Mediterranean and Black Sea
| FAO Major Fishing Areas | 37 - Mediterranean and Black Sea |
More Geo References The following area codes have been found as intersecting the location of European Union Mediterranean and Black Sea fishing fleetFishing Capacity Based on the submitted data, the European fleet fishing in the Mediterranean and Black Sea consisted ofaround 21,179 vessels, with a total gross tonnage (GT) of 228 thousand tonnes and total kilowatts (kW)of 1.43 million in 2010. The Italian fleet accounted for around 71% of the total number of vesselsfollowed, at a very long distance, by the Bulgarian fleet (13%). When analysing the distribution of grosstonnage among countries, Italy still has the top position (80%), while Bulgaria shifts to fourth positionafter France and Malta. These positions are confirmed when analysing the power in terms of kW. Thismeans that Bulgarian vessels have a smaller average dimension (4 GT and 29 kW on average) ifcompared with Italian vessels, and especially with the French vessels (15 GT and 100 kW on average). 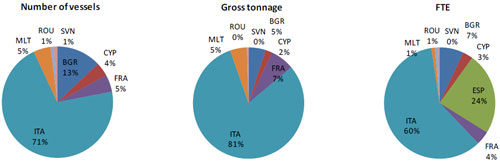 | Figure 4.2.1 EU Mediterranean and Black Sea fleet capacity and employment 2010 Source: EU Member States DCF data submissions  |
The oldest fleet is the Slovenian fleet, with vessels averaging 35 years in 2010, followed by the French and the Maltese fleets with average ages of 29 years and 28 years, respectively in 2010. Based on expertknowledge and on available data, it can be said that the Portuguese fishery in the Mediterranean area iscarried out by very few boats: only 2-3 vessels (polyvalent and long-lines), registered in ports of theAzores Island and Mainland, operating in this area only in specific seasons catching shrimps. Employment Employment data submitted suggests that the total fishers employed and corresponding FTEs,harmonised and national, in the Mediterranean and Black Sea were 46,472, 31,900 and 35,794 in 2010,respectively. The Italian fleet accounted for around 60% of the total FTEs (62% for total employed),followed by the Spanish fleet (24% and 22% of total employed and FTEs) and then the Bulgarian fleet(7%). Based on the available data, a vessel operating in the region (excluding the Mediterranean Spanish vessels for which 2010 capacity data have not been provided) will employ on average 2 fishermen,corresponding to one FTE per vessel. Production 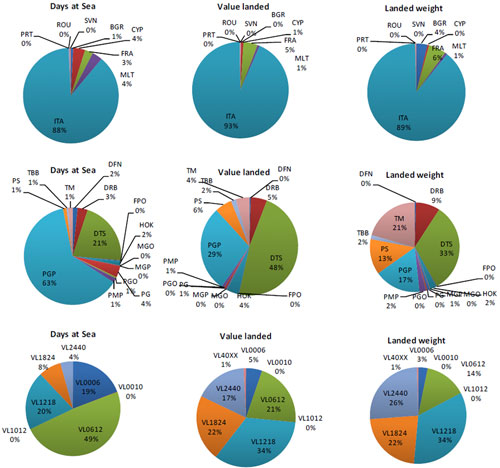 | | Figure 4.2.2 EU Mediterranean and Black Sea fleet effort and landings in 2010 Source: EU Member States DCF data submissions |
The Mediterranean and Black Sea fleet (with the exception of Spain and Greece that did not submitdata) spent a total of around 2 million days at sea in 2010, and an average of 89 days per vessel. Of thecountries who submitted data, the Italian fleet accounted for 88% of the total number of days, followed,at a distance, by the Cypriot and Maltese fleets (both 4% of the total). Based on the data submitted, thetotal energy (fuel) consumption amounts to 453 million litres in 2010, however because of the lack ofdata from Greece and Spain in reality the total should be significantly higher. Of the Member States whodid provide data, the Italian fleet consumes, on total, the largest amount of fuel (89%) while, onaverage, the French vessels are the least fuel efficient (35 thousand litres per vessel in 2010), followedby the Italian fleet (27 thousand litres). Based on the data submitted, the total volume and value of landings achieved by the Mediterraneanand Black Sea fleet in 2010 (excluding Greece and Spain) were 1,184 thousand tonnes and €251 millionrespectively. It should again be outlined that the lack of Spanish and Greek data does not allow for avery realistic analysis of the Euro-Mediterranean fishery fleet production. The Italian fleet produced thehighest volume of landings in the region (93%), followed by the French fleet (5%). The Italian fleet alsoproduced the highest value of landings (89%), followed, again, by the French fleet (6%). The passive gears are the most important gears in terms of effort, accounting for 63% of the total andfollowed by the demersal trawlers (21%). Demersal trawlers are, instead, the most important in terms ofboth weight and value of landings (33% and 48%, respectively). The 2010 average first-sale price was 4.71 €/kg, with the highest value registered for Portugueselandings (7.81 €/kg) and the lowest for Bulgarian landings (0.23 €/kg). Based on expert knowledge theBulgarian average price should be very similar to Romanian values (around 2 €/kg), taking into accountthe common features of the two fishing fleets, exploiting more or less the same stocks. Theinconsistency in the average prices should be attributed, accordingly to the experts’ knowledge, to thelack of data (submitted) on Bulgarian landings (turbot data are missing for the period 2008-2010).Furthermore, for the sake of homogeneity of the analysis, it should be said that, even if theMediterranean and Black sea are merged into the same FAO area (37), the respective fisheries are verydifferent, especially from a biological point of view. The main species exploited in the Black sea (spratand turbot) do not have the same importance for other Med fleets. Furthermore, we should underlinethat according to EC policies a TAC system was introduced just 3 years ago for Romanian and Bulgarianfleets exploiting sprat and turbot (TACs are usually not applied and applicable in the Mediterraneanfisheries). 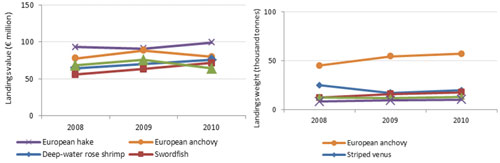 | | Figure 4.2.3 EU Med. and Black Sea fleet volume and value of top 8 species landed Source: EU Member States DCF data submissions |
Excluding data on the Greek and Spanish fleet, the 5 most important species landed by the EUMediterranean and Black Sea fleets in terms of volume in 2010 were European anchovy, sardine(pilchards), deep-water rose shrimp, clams (striped venus) and European hake. Anchovy is the topspecies with a volume, in 2010, of 57 thousand tonnes, 23% of the total amount of landings in 2010 andan increase of around 26% in the period 2008-2010 (fig. 4.2.3 left). Anchovy is the most importantspecies in the Mediterranean as it has the greatest influence on the total volume of production.The second most important species in terms of volume landed is clams. In 2010 the total volume ofclams landed was around 19 thousand tonnes (8% of total landings). This species is mainly landed in the Adriatic Sea by Italian dredgers. Sardines (European pilchards) were the third most important species interms of volume landed in 2010, amounting to 17.7 thousand tonnes (7% of total landings).Excluding data on the Greek and Spanish fleets, the five most important species landed by the EUMediterranean and Black Sea fleets in terms of value in 2010 were hake, deep water rose shrimp,cuttlefish, anchovy, and swordfish. In 2010 the value of hake landed was the highest of all species,amounting to €99 million, 8% of the total value of landings in 2010 and an increase of 7% in the period2008-2010 (fig. 4.2.3 right). The second most important species in terms of value is anchovy, whichamounted to €79 million (7% of the total value) in 2010. Deep water rose shrimp were the third mostimportant species in terms of value in 2010, amounting to €75 million (6% of the total value). None ofthese species account for more than 8% of the total value of landings, highlighting the fact that theMediterranean and Black Sea fisheries are highly diversified and not overly dependent on any oneparticular species at the regional level. Additionally, it is interesting to note that European hake istargeted by several different segments of the fleet using different gear types. Socioeconomic Assessment Data EU Member States fishing in Mediterranean waters include Spain, France, Italy, Slovenia, Greece, Malta,Cyprus and Portugal. Bulgaria and Romania fish exclusively in the Black sea. In terms of data availability,Greece did not submit any data. Spain did not submit any data on volume and value of landings byspecies, fishing effort or capacity. Slovenia did not submit data on effort and landings for 2008 and 2009for the Mediterranean area. For Portugal, only data on landings (volume and value) and effort for 2010(and very few data for 2008) has been submitted while information on the fleet consistency iscompletely missing. As a result of missing Greek and Spanish data (known to be major Mediterraneanplayers), Italian production appears to represent the major part of the totals (see following graphs). Afully comprehensive and realistic analysis could therefore not be carried out. Data issues: as described above, due to the data availability and quality, not all relevant EU fleets were included in the Mediterranean and Black Sea regional analysis. Please refer to the Source of Information for more details on data quality and coverage. Results Economic Performance Under the DCF, economic data is requested at supra region level. As the Mediterranean and Black Searegion falls under one specific supra region (Area 37) it is possible to calculate profitability indicators forfleets that operate solely within the region. Tables 4.2.1, 4.2.2 and 4.2.3 contain a summary of economicperformance of the Mediterranean and Black Sea fleet by Member State, gear type and fleet segmentsrespectively. Taking into account that for some MS data are not available for all fleet segments, thisanalysis is mostly focused on table 4.2.1. The total income of the fleet operating in Area 37 was equal, in 2010, to €1 596 million. Direct subsidiesaccounted for €33 million, equal to 2% of total income. Direct subsidies as a proportion of total incomelargely varies among MS, with the highest share for Cyprus (16.3%) and the lowest for France (0.2%). The total GVA of Area 37 was equal to €864 million, representing 54% of total income. Two MS (Bulgariaand Cyprus) show a negative GVA, meaning that operating costs (excluding labour costs) exceededincomes. Again, the share largely varies among MS, with the highest share for France (58%) and thelowest (positive) for Malta (13.5%). The lower the share, the higher the incidence of operating costs(excluding the remuneration of labour). The gross profit of the area was equal, in 2010, to €332 million, amounting to 21% of total income and38% of GVA, indicating that more than a half (62%) of the GVA is destined to the remuneration of thelabour factor. The large differences between MS give an idea on how the GVA is used to remunerate theproduction factors in the area (as mentioned above, more than a half is destined to the labour factor inmost of the MS). The net profit of Area 37 is equal to €75 million in 2010 (5% of total income excluding subsidies). It isnegative for five MS and positive for the rest (Italy, France and Romania). The average value of the finalresult of the production largely varies among the Med MS. On average a vessel produced, in 2010, a netprofit of €3,500. The highest value is observable for France, with about €19,400. The lowest positivevalue is registered for Romania (€158) while the lowest negative was recorded for Maltese vessels (-€20,000). In terms of crew remuneration, the average wage per FTE for Med fisherman is €12,200 per annum.Again the difference among MS is large: the highest average wage was observed for French fishermen(€35,000) and the lowest for Romanian (€486). Table 4.2.2 suggests that dredges were the most profitable gear type in the Mediterranean and BlackSea region in 2010, with GVA and profits as a proportion of total income of 75% and 42% respectively.Crew wage per FTE was around €52,300 for this gear type in 2010, the highest at fleet segment level. 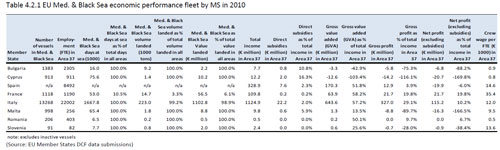 | | Table 4.2.1 EU Med. & Black Sea economic performance fleet by MS in 2010 Source: EU Member States DCF data submissions |
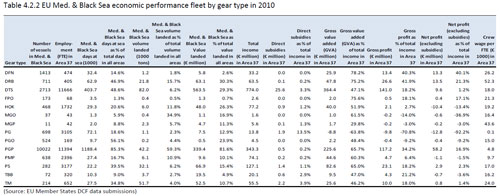 | | Table 4.2.2 EU Med. & Black Sea economic performance fleet by gear type in 2010 Source: EU Member States DCF data submissions |
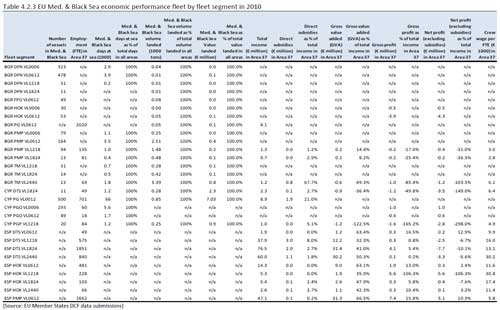 | | Table 4.2.3 EU Med. & Black Sea economic performance fleet by fleet segment in 2010 Source: EU Member States DCF data submissions |
Source of Information “The 2012 Annual Economic Report on the EU Fishing Fleet (STECF-12-10)” Scientific, Technical and Economic Committee for Fisheries (STECF) . 2012  http://stecf.jrc.ec.europa.eu/documents/43805/366433/12-08_STECF+12-10+-+AER+EU+Fleet+2012_JRC73332.pdf http://stecf.jrc.ec.europa.eu/documents/43805/366433/12-08_STECF+12-10+-+AER+EU+Fleet+2012_JRC73332.pdf |
|
|


