Harvested Resource
Type of production system: Industrial
Fishery Area
Climatic zone: Polar; Temperate; Tropical. Horizontal distribution: Oceanic. Vertical distribution: Pelagic.
Geo References 
| Pacific Tuna and Tuna-like Reporting areas | EPO - East Pacific Ocean |
More Geo References
The following area codes have been found as intersecting the location of
EPO Tunas and billfishes fisheryAssociated Species (Bycatch)
This document summarizes the catches and effort of the fisheries for species covered by the IATTC’s Antigua Convention (“
tunas and tuna-like species and other species of fish taken by vessels fishing for tunas and tuna-like species”) in the eastern Pacific Ocean (EPO) in 2021. The most important of these species are the scombrids (family Scombridae), which include tunas, bonitos, seerfishes, and some mackerels.
Almost all the catches in the EPO are made by the purse-seine and longline fleets; pole-and-line vessels, and various artisanal and recreational fisheries, account for a small percentage of the total catches. The IATTC staff compiles catch data for all fishing gears, including trolls, harpoons, and gillnets.
Detailed catch data are available for the purse-seine fishery, which takes over 90% of the total reported catches; the data for the other fisheries are incomplete. Purse-seine data for 2020 and 2021, and 2019-2021 data for longlines and other gears, are preliminary.
Access to the fisheries is regulated by Resolution
C-02-03, which allows only vessels on the IATTC
Regional Vessel Register to fish for tunas in the EPO. Vessels are authorized to fish by their respective flag governments, and only duly authorized vessels are included in the Register. The Register lists, in addition to a vessel’s name and flag, its fishing gear, dimensions, carrying capacity, date of construction, ownership, home port, and other characteristics. However, this requirement has not been applied to the thousands of small artisanal vessels, called
pangas, that are known to catch tunas, among other species, in coastal waters of the EPO, but data on their numbers, effort, and catches are incomplete or unavailable. A pilot program, focused on sharks, to collect data on these fisheries in Central America has been completed (
SAC-11-14). The results of the pilot study will offer guidance in the development of a long-term sampling program in the region.
The IATTC staff has collected and compiled data on the longline fisheries since 1952, on catches of yellowfin and skipjack since 1954, bluefin since 1973, and bigeye since 1975. The data in this report, which are as accurate and complete as possible, are derived from various sources, including vessel logbooks, on-board observer data, unloading records provided by canners and other processors, export and import records, reports from governments and other entities, and the IATTC species and size composition sampling program.
All weights of catches and discards are in metric tons (t). In the tables, 0 means no effort, or a catch of less than 0.5 t; - means no data collected; * means data missing or not available.
Resources Exploited
The principal species of tunas caught are:
Albacore - Northern PacificBigeye tuna - Eastern Pacific (EPO)Skipjack tuna - Eastern PacificYellowfin tuna - Eastern PacificThe principal species of tunas caught are the three tropical tuna species (yellowfin, skipjack, and bigeye), followed by the temperate tunas (albacore, and lesser catches of Pacific bluefin); other scombrids, such as bonitos and wahoo, are also caught. In addition to the tunas, this document covers the billfishes (swordfish, marlins, shortbill spearfish, and sailfish).
There are important fisheries for dorado, sharks, and other species and groups that interact with the tuna fisheries in the EPO and are thus within the IATTC’s remit. Information on these other species such as carangids (yellowtail, rainbow runner, and jack mackerel), dorado, elasmobranchs (sharks, rays, and skates), among others, is provided in
Document SAC-13-10, Ecosystem considerations.
Fleet segment
THE FLEETS The purse-seine and pole-and-line fleets
The IATTC
Regional Vessel Register contains detailed records of all purse-seine vessels that are authorized to fish for tunas in the EPO. However, only vessels that fished for yellowfin, skipjack, bigeye, and/or Pacific bluefin tuna in the EPO in 2021 are included in the following description of the purse-seine fleet.
The IATTC uses well volume, in cubic meters (m3), to measure the carrying capacity of purse-seine vessels. Reliable well volume data are available for almost all purse-seine vessels; the well volume of vessels lacking such data is calculated by applying a conversion factor to their capacity in tons shown in (
Table A-10); (Figure 2).
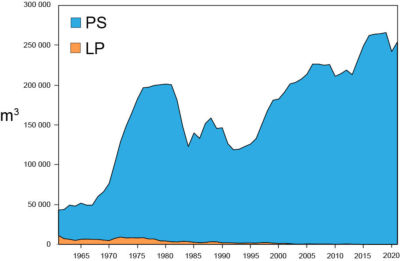 |
Figure 2: Carrying capacity, in cubic meters of well volume, of the purse-seine and pole-and-line fleets in the EPO, 1961-2021  |
The 2020 and preliminary 2021 data for numbers and total well volumes of purse-seine vessels that fished for tunas in the EPO are shown in (
Table A-11a) and (
Table A-11b). During 2021, the fleet was dominated by Ecuadorian and Mexican vessels, with about 32% and 24%, respectively, of the total well volume; they were followed by the Panama (11%), United States (10%), Venezuela (9%), Colombia (6%), European Union (Spain) (3%), El Savador (2%), Nicaragua (2%), and Peru (1%). (The sum of the percentages may not add up to 100% due to rounding.)
The cumulative capacity at sea during 2021 is compared to those of the previous five years in
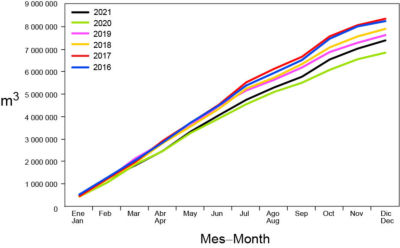 |
| Figure 3: Cumulative capacity of the purse-seine and pole-and-line fleet at sea, by month, 2016-2021. |
The monthly average, minimum, and maximum total well volumes at sea (VAS), in thousands of cubic meters, of purse-seine and pole-and-line vessels that fished for tunas in the EPO during 2011-2020, and the 2021 values, are shown in (
Table A-12). The monthly values are averages of the VAS estimated at weekly intervals by the IATTC staff. The average VAS values for 2011-2020 and 2021 were slightly lower 142 thousand m
3 (59% of total capacity) and about 144 thousand m
3 (57% of total capacity), respectively.
Other fleets of the EPOInformation on other types of vessels that are authorized to fish in the EPO is available in the IATTC’s
Regional Vessel Register. In some cases, particularly for large longline vessels, the Register contains information for vessels authorized to fish not only in the EPO, but also in other oceans, and which may not have fished in the EPO during 2021, or ever.
Catch
Since 1993 all Class-6, purse-seine vessels with carrying capacities greater than 363 metric tons (t), carry observers who collect detailed data on catches, including those discarded at sea. Estimates of the “retained” catch (the portion of the total catch that is landed) are based principally on data collected during vessel unloadings.
Longline vessels, particularly the larger ones, fish primarily for bigeye, yellowfin, albacore, and swordfish. Data on the retained catches of most of the larger longline vessels are obtained from the vessels’ flag governments; data for smaller longliners, artisanal vessels, and other vessels that fish for species covered by the Antigua Convention are incomplete or unavailable, but some are obtained from vessel logbooks, or from governments or governmental reports.
Data for the western and central Pacific Ocean (WCPO) are taken from the
Tuna Fishery Yearbook for 2020, published by the Western and Central Pacific Fisheries Commission (WCPFC).
This report summarizes data from all the above sources. The estimated total catches of tropical tunas (yellowfin, skipjack, and bigeye) in the entire Pacific Ocean are shown in (
Table A-1) and are discussed further in the sections below.
Estimates of the annual retained and discarded catches of tunas and other species taken by tuna-fishing vessels in the EPO during 1992-2021 are shown in (
Table A-2a), (
Table A-2b)
The catches of tropical tunas during 1992-2021, by flag, are shown in (
Table A-3a), (
Table A-3b), (
Table A-3c), (
Table A-3d), (
Table A-3e), and the purse-seine catches and landings of tunas during 2020-2021 are summarized by flag in (
Table A-4a), (
Table A-4b).
Catches by speciesYellowfin tunaThe total annual catches of yellowfin in the Pacific Ocean during 1992-2021 are shown in (
Table A-1)
The 2021 EPO catch of 254 thousand t is 4% higher than the average of 244 thousand t for the previous 5-year period (2016-2020). In the WCPO, the catches of yellowfin reached a record high of 722 thousand t in 2020.
The annual retained catches of yellowfin in the EPO, by gear, during 1992-2021 are shown in Table A-2a. Over the most recent 15-year period (2006-2020), the annual retained purse-seine and pole-and-line catches have fluctuated around an average of 217 thousand t (range: 167 to 251 thousand t). The preliminary estimate of the retained catch in 2021, 253 thousand t, is 16% higher than that of 2020, and 11% higher than the 2006-2020 average. On average, about 0.3% (range: 0.1 to 1.0%) of the total purse-seine catch of yellowfin was discarded at sea during 2006-2020 (
Table A-2a). During 1991-2005, annual longline catches in the EPO averaged about 22 thousand t (range: 12 to 31 thousand t), or about 7% of the total retained catches of yellowfin. They then declined sharply, to an annual average of 10 thousand t (range: 8 to 13 thousand t), or about 4% of the total retained catches, during 2006-2020. Catches by other fisheries (recreational, gillnet, troll, artisanal,
etc.), whether incidental or targeted, are shown in Table A-2a, under “Other gears” (OTR); during 2006-2020 they averaged about 3 thousand.
Skipjack tunaThe total annual catches of skipjack in the Pacific Ocean during 1992-2021 are shown in (
Table A-1). Most of the catch is taken in the WCPO. Prior to 1998, WCPO catches averaged about 900 thousand t; subsequently, they increased steadily, from 1.1 million t to an all-time high of 2 million t in 2019. In the EPO, the greatest catches occurred between 2005 and 2021, ranging from 153 to 365 thousand t, the record catch in 2019.
The annual retained catches of skipjack in the EPO, by gear, during 1992-2021 are shown in (
Table A-2a). During 2006-2020 the annual retained purse-seine and pole-and-line catch averaged 279 thousand t (range: 147 to 347 thousand t). The preliminary estimate of the retained catch in 2021, 325 thousand t, is 16% greater than the 15-year average for 2006-2020.
Discards of skipjack at sea decreased each year during the period, from 4% in 2006 to a low of less than 1% in 2018, averaging about 1.5% of the total catch of the species (Table A-2a).
Catches of skipjack in the EPO by longlines and other gears are negligible (Table A-2a).
Bigeye tunaThe total annual catches of bigeye in the Pacific Ocean during 1992-2021 are shown in (
Table A-1). Overall, the catches in both the EPO and WCPO have increased, but with considerable fluctuations. In the WCPO they averaged more than 77 thousand t during the late 1970s, decreased during the early 1980s, and then increased steadily to 127 thousand t in 1992; they jumped to 163 thousand t in 1999, and reached a high of 183 thousand t in 2004, since when they have fluctuated between 130 and 171 thousand t. In the EPO, the average catch during 1992-2021 was 104 thousand t, with a low of 75 thousand t in 2021 and a high of 149 thousand t in 2000.
The annual retained catches of bigeye in the EPO by purse-seine and pole-and-line vessels during 1992-2021 are shown in
Table A-2a. The introduction of fish-aggregating devices (FADs), placed in the water by fishers to attract tunas, in 1993 led to a sudden and dramatic increase in the purse-seine catches. Prior to 1993, the annual retained purse-seine catch of bigeye in the EPO was about 5 thousand t (Table A-2a); by 1994 it was 35 thousand t, and in 1996 was over 60 thousand t. During 1997-2020 it has fluctuated between 44 and 95 thousand t; the preliminary estimate for 2021 is 58 thousand t. (
Table A-2a). During 2000-2021 the percentage of the purse-seine catch of bigeye discarded at sea has steadily decreased, from 5% in 2000 to less than 1% in multiple years, averaging about 1.5%.
Before the expansion of the FAD fishery, longliners caught almost all the bigeye in the EPO, averaging 88 thousand t annually during 1985-1992. Since 1993, the annual average catch has declined by 52%, to 42 thousand t, and the preliminary estimate for 2021 is less than 18 thousand t (Table A-2a).
Small amounts of bigeye are caught in the EPO by other gears Table A-2a.
Pacific bluefin tunaThe catches of Pacific bluefin in the entire Pacific Ocean, by flag and gear, as reported by the vessels’ flag governments to the International Scientific Committee for Tuna and Tuna-like Species in the North Pacific Ocean (ISC), are shown in (
Table A-5a).
The catches of Pacific bluefin in the EPO during 1992-2021, by gear, are shown in Table A-2a. In recent years, purse-seine vessels accounted for over 91% of the annual catch. The 1992-2020 average EPO retained catch is 3.8 thousand t (range: 600 t to 9.9 thousand t); the preliminary estimate for 2021 is 3.1 thousand t (
Table A-2a).
Catches of Pacific bluefin by recreational gear in the EPO are reported in numbers of individual fish caught, whereas all other gears report catches in weight; the data are therefore converted to weights for inclusion in the EPO catch totals. The original catch data for 1992-2021, in numbers of fish, are presented in (
Table A-5b).
Albacore tunaData provided by the relevant CPCs on catches of albacore in the EPO, by gear and area (north and south of the equator), are shown in (
Table A-6), and for the entire EPO in (
Table A-2a). A portion of the albacore catch is taken by troll vessels (LTL), included under “Other gears” (OTR) in Table A-2a.
Other tunas and tuna-like speciesWhile yellowfin, skipjack, and bigeye tunas comprise the great majority of the retained purse-seine catches in the EPO, other tunas and tuna-like species, such as albacore, black skipjack, bonito, frigate and bullet tunas, contribute to the overall harvest. The estimated annual retained and discarded catches of these species during 1992-2021 are shown in Table A-2a. The catches reported in the “unidentified tunas” (TUN) category in Table A-2a contain some catches reported by species (frigate and bullet tunas) along with the unidentified tunas. The total retained catch of these other species by the purse-seine fishery in 2021 was 11.9 thousand t, greater than the 2006-2020 average of 9.5 thousand t (range: 5 to 19 thousand t) (
Table A-2a). Black skipjack are also caught by other gears in the EPO, mostly by coastal artisanal fisheries. Bonitos are also caught by artisanal fisheries and have been reported as catch by longline vessels in some years.
BillfishesCatch data for billfishes (swordfish, blue marlin, black marlin, striped marlin, shortbill spearfish, and sailfish) are shown in (
Table A-2).
Swordfish are caught in the EPO with large-scale and artisanal longlines, gillnets, harpoons, and occasionally with recreational gear. During 1999-2013 the longline catch averaged 15 thousand t, but during 2014-2016 this increased by about 50%, to over 23 thousand t, possibly due to increased abundance of swordfish, increased effort directed toward the species along with improved fishing efficiency, increased reporting, or a combination of all of these.
Other billfishes are caught with large-scale and artisanal longlines and recreational gear. The average annual longline catches of blue marlin and striped marlin during 2006-2020 were about 3.1 thousand and 1.9 thousand t, respectively. Smaller amounts of other billfishes are taken by longline.
Little information is available on the recreational catches of billfishes, but, the retained catches are believed to be substantially less than the commercial catches for all species, due to catch-and-release practices.
Billfishes are caught incidentally in the purse-seine fisheries, which during 2006-2020 accounted for about 1% of the total catch of billfishes in the EPO. Prior to 2011, they were all classified as discarded dead; however, the growing rate of retention of such bycatches made it important to reflect this in the data, and since 2011 retained catch and discards are reported separately in Table A-2b.
Distributions of the catches of tunasPurse-seine catchesThe average annual distributions of purse-seine catches, by set type, of tropical tunas (yellowfin, skipjack, and bigeye) in the EPO during 2016-2020 are shown in Figures A-1a, A-2a, and A-3a,
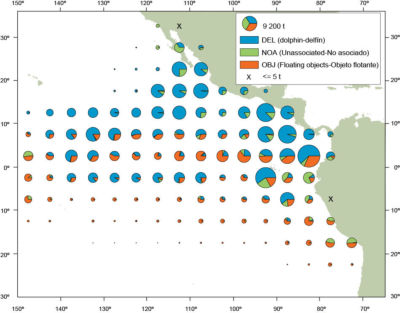 |
| Figure A-1a: Average annual distributions of the purse-seine catches of yellowfin, by set type, 2016-2020. The sizes of the circles are proportional to the amounts of yellowfin caught in those 5° by 5° areas. |
 |
| Figure A-2a: Average annual distributions of the purse-seine catches of skipjack, by set type, 2016-2020. The sizes of the circles are proportional to the amounts of skipjack caught in those 5° by 5° areas. |
 |
| Figure A-3a: Average annual distributions of the purse-seine catches of bigeye, by set type, 2016-2020. The sizes of the circles are proportional to the amounts of bigeye caught in those 5° by 5° areas. |
respectively, and preliminary estimates for 2021 are shown in Figures A-1b, A-2b, and A-3b.
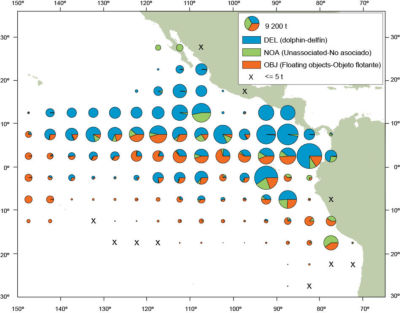 |
| Figure A-1b: Annual distributions of the purse-seine catches of yellowfin, by set type, 2021. The sizes of the circles are proportional to the amounts of yellowfin caught in those 5° by 5° areas. |
 |
| Figure A-2b: Annual distributions of the purse-seine catches of skipjack, by set type, 2021. The sizes of the circles are proportional to the amounts of skipjack caught in those 5° by 5° areas. |
 |
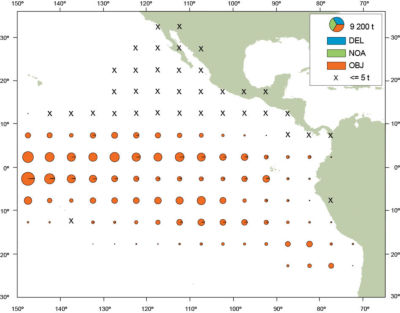
| Figure A-3b: Annual distributions of the purse-seine catches of bigeye, by set type, 2021. The sizes of the circles are proportional to the amounts of bigeye caught in those 5° by 5° areas. |
Most of the yellowfin catches in 2021 were taken in sets associated with dolphins in two principal areas: north of 5°N from 105°W to 145°W, and inshore north of 5°S from 95°W to the coast. Lesser amounts were taken in dolphin and floating-object sets throughout the EPO south of 10°N (Figure A-1b).
The skipjack catches in 2021 occurred primarily in unassociated tuna sets from Galapagos to the coast of South America, and in floating object sets south of 10°N throughout the EPO. The area off the coast of Peru yielded the highest skipjack catch, producing more skipjack in this area than in previous years (Figure A-2b).
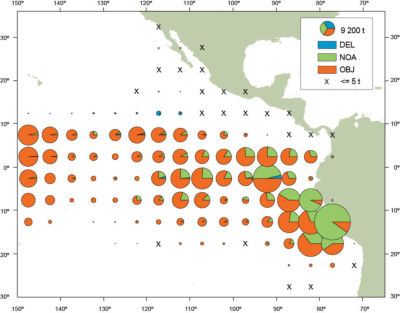 |
| Figure A-2b: Annual distributions of the purse-seine catches of skipjack, by set type, 2021. The sizes of the circles are proportional to the amounts of skipjack caught in those 5° by 5° areas. |
Bigeye are not often caught north of about 7°N in the EPO. Almost all of the 2021 catches were taken in sets on FADs between the 10°N and 10°S and west of 115°W (Figure A-3b).
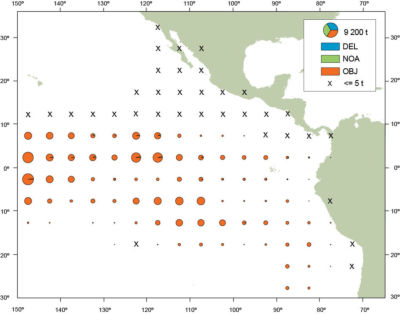 |
| Figure A-3b: Annual distributions of the purse-seine catches of bigeye, by set type, 2021. The sizes of the circles are proportional to the amounts of bigeye caught in those 5° by 5° areas. |
Longline catchesSince 2009, the IATTC has received tuna catch and effort data from Belize, China, France (French Polynesia), Japan, the Republic of Korea, Panama, Chinese Taipei, the United States, and Vanuatu. Albacore, bigeye and yellowfin tunas make up the majority of the catches by most of these vessels. The distributions of the catches of bigeye and yellowfin in the Pacific Ocean by Chinese, Japanese, Korean, and Chinese Taipei longline vessels during 2016-2020 are shown in Figure A-4.
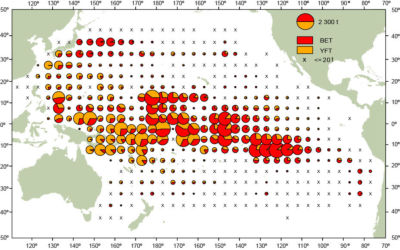 |
| Figure A-4: Distributions of the average annual catches of bigeye and yellowfin tunas in the Pacific Ocean, in metric tons, by Chinese, Japanese, Korean, and Chinese Taipei longline vessels, 2016-2020. The sizes of the circles are proportional to the amounts of bigeye and yellowfin caught in those 5° by 5° areas. |
Size compositions of the catches of tunasPurse-seine, pole-and-line, and recreational fisheriesLength-frequency samples are the basic source of data used for estimating the size and age compositions of the various species of fish in the landings. This information is necessary to obtain age-structured estimates of the populations for various purposes, primarily the integrated modeling that the staff uses to assess the status of the stocks
Stock Assessment Reports. The results of such studies have been described in several IATTC Bulletins, in its Annual Reports for 1954-2002, and in its Stock Assessment Reports.
Length-frequency samples are obtained from the catches of purse-seine vessels in the EPO by IATTC personnel at ports of landing in Ecuador, Mexico, Panama, and Venezuela.
The methods for sampling the catches of tunas are described in the
IATTC Annual Report for 2000 and in IATTC
Stock Assessment Reports 2 and
4.
Historical long-term time series of size-composition data for yellowfin and bigeye are available in the
Stock Assessment Reports, and average length stock status indicators (SSIs) are available for yellowfin, bigeye and skipjack (
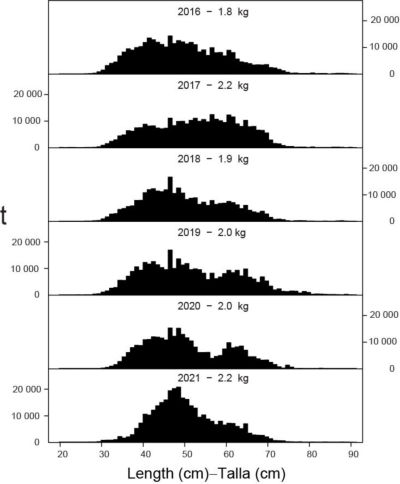
SAC-11-05). In this report, data on the size composition of the catches during 2016-2021 are presented (Figures A-6 to A-8), with two sets of length-frequency histograms for each species: the first shows the data for 2021 by stratum (gear type, set type, and area), and the second the combined data for each year of the 2016-2021 period (Figure A-6), (Figure A-7) and (Figure A-8).
 |
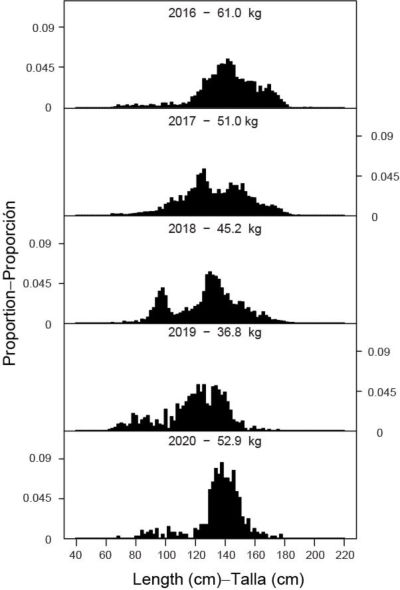
| Figure A-6a: Estimated size compositions of the yellowfin caught in the EPO during 2021 for each fishery designated in Figure A-5. The value at the top of each panel is the average weight of the fish in the samples. |
 |
| Figure A-6b: Estimated size compositions of the yellowfin caught by purse-seine and pole-and-line vessels in the EPO during 2016-2021. The value at the top of each panel is the average weight of the fish in the samples. |
 |
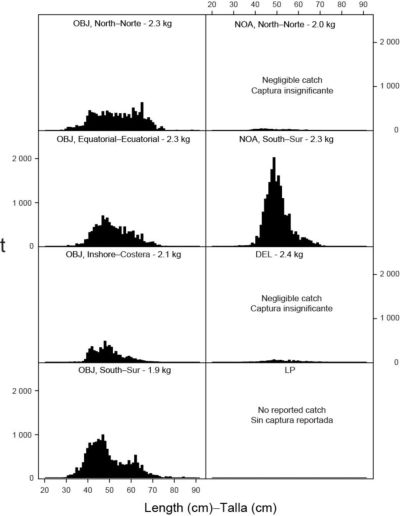
| Figure A-7a: Estimated size compositions of the skipjack caught in the EPO during 2021 for each fishery designated in Figure A-5. The value at the top of each panel is the average weight of the fish in the samples. |
 |
| Figure A-7b: Estimated size compositions of the skipjack caught by purse-seine and pole-and-line vessels in the EPO during 2016-2021. The value at the top of each panel is the average weight of the fish in the samples. |
 |
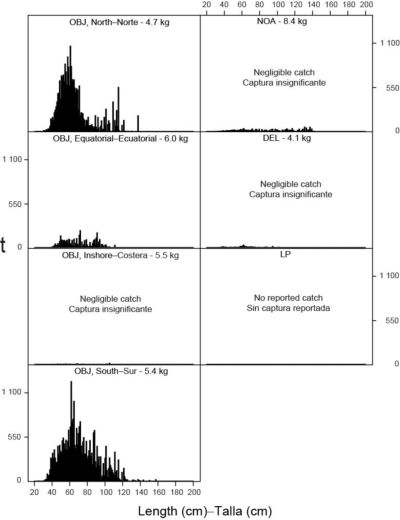
| Figure A-8a: Estimated size compositions of the bigeye caught in the EPO during 2021 for each fishery designated in Figure A-5. The value at the top of each panel is the average weight. |
 |
| Figure A-8b: Estimated size compositions of the bigeye caught by purse-seine vessels in the EPO during 2016-2021. The value at the top of each panel is the average weight. |
For stock assessments of yellowfin, nine purse-seine fisheries (four associated with floating objects (OBJ), three associated with dolphins (DEL), and two unassociated (NOA)) and one pole-and-line (LP) fishery, which includes all 13 sampling areas) are defined (Figure A-5).
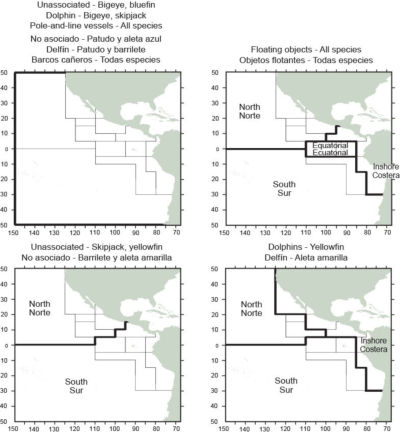 |
| Figure A-5: The purse-seine fisheries defined by the IATTC staff for analyses of yellowfin, skipjack, and bigeye in the EPO. The thin lines indicate the boundaries of the 13 length-frequency sampling areas, and the bold lines the boundaries of the fisheries. |
Of the 633 wells with fish caught during 2021, 566 contained yellowfin. The estimated size compositions of the fish caught are shown in Figure A-6a.
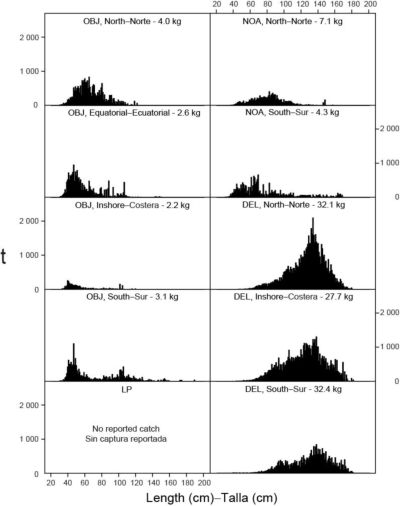 |
| Figure A-6a: Estimated size compositions of the yellowfin caught in the EPO during 2021 for each fishery designated in Figure A-5. The value at the top of each panel is the average weight of the fish in the samples. |
Most of the yellowfin catch was taken in the DEL fisheries during the first three quarters of the year, with smaller amounts taken in the OBJ-N and OBJ-E fisheries in the last three quarters. Large yellowfin (120-160 cm) was caught almost exclusively in the DEL fisheries, primarily in the DEL-N fishery in the first three quarters, the DEL-I fishery in the first and second quarters, and the DEL-S fishery in the first quarter. Smaller yellowfin (<60 cm) was taken in the OBJ-N and OBJ-E fisheries primarily in the first and second quarters.
The estimated size compositions of the yellowfin caught by all fisheries combined during 2016-2021 are shown in Figure A-6b.
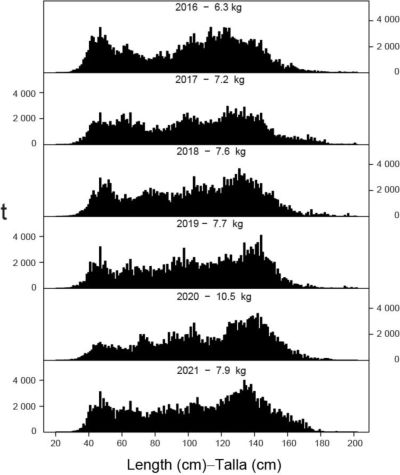 |
| Figure A-6b: Estimated size compositions of the yellowfin caught by purse-seine and pole-and-line vessels in the EPO during 2016-2021. The value at the top of each panel is the average weight of the fish in the samples. |
The average weight of yellowfin in 2021, 7.9 kg, was much lower than the 2020 average of 10.6 kg, but was similar to the average for other years in the graphic (6.3-7.7 kg). The 2021 size distribution was similar to that of previous years, with fish in the 120-150 cm range most commonly encountered.
For stock assessments of skipjack, seven purse-seine (four OBJ, two NOA, one DEL) and one LP fishery are defined (Figure A-5).
 |
| Figure A-5: The purse-seine fisheries defined by the IATTC staff for analyses of yellowfin, skipjack, and bigeye in the EPO. The thin lines indicate the boundaries of the 13 length-frequency sampling areas, and the bold lines the boundaries of the fisheries. |
the last two include all 13 sampling areas. Of the 633 wells with fish caught, 339 contained skipjack. The estimated size compositions of the fish caught during 2021 are shown in Figure A-7a.
 |
| Figure A-7a: Estimated size compositions of the skipjack caught in the EPO during 2021 for each fishery designated in Figure A-5. The value at the top of each panel is the average weight of the fish in the samples. |
Most of the skipjack catch was taken in the OBJ-N, OBJ-E and OBJ-S fisheries in all four quarters, and in the NOA-S fishery in the first and second quarters. The largest skipjack (60-70 cm) were caught in the OBJ-N fishery in the second and third quarters. The smallest (<40 cm) were caught primarily in the OBJ-N, OBJ-E and OBJ-S fisheries in the third and fourth quarters.
The estimated size compositions of skipjack caught by all fisheries combined during 2016-2021 are shown in Figure A-7b.
 |
| Figure A-7b: Estimated size compositions of the skipjack caught by purse-seine and pole-and-line vessels in the EPO during 2016-2021. The value at the top of each panel is the average weight of the fish in the samples. |
The majority of the skipjack in 2021 was in the 40-55 cm range.
For stock assessments of bigeye, six purse-seine (four OBJ, one NOA, one DEL) and one LP fishery are defined (Figure A-5);
 |
| Figure A-5: The purse-seine fisheries defined by the IATTC staff for analyses of yellowfin, skipjack, and bigeye in the EPO. The thin lines indicate the boundaries of the 13 length-frequency sampling areas, and the bold lines the boundaries of the fisheries. |
all except the OBJ fisheries include all 13 sampling areas. Of the 633 wells with fish caught, 119 contained bigeye. The estimated size compositions of the fish caught during 2021 are shown in Figure A-8a.
 |
| Figure A-8a: Estimated size compositions of the bigeye caught in the EPO during 2021 for each fishery designated in Figure A-5. The value at the top of each panel is the average weight. |
Most of the bigeye catch was taken in the OBJ-N fishery in the second and third quarters, and in the OBJ-S fishery throughout the year. Lesser amounts were caught in the OBJ-E fishery in the second quarter.
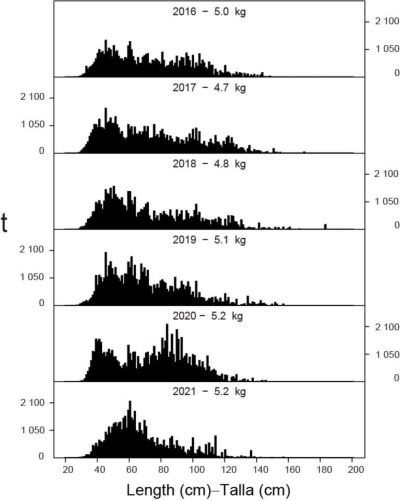
The estimated size compositions of bigeye caught by all fisheries combined during 2016-2021 are shown in Figure A-8b.
 |
| Figure A-8b: Estimated size compositions of the bigeye caught by purse-seine vessels in the EPO during 2016-2021. The value at the top of each panel is the average weight. |
The average weight of bigeye in 2021 (5.2 kg) was consistent with the previous five years (4.7-5.2 kg). The majority of bigeye caught in 2021 was in the 40-80 cm range, with much less of the larger bigeye >100 cm than in previous years.
Pacific bluefin are caught by purse-seine and recreational gears off California and Baja California, historically from about 23°N to 35°N, but only between 28°N and 32°N in recent years. The 2021 purse-seine fishing season continued the trend of starting earlier than any previous year: in 2021, bluefin were first caught in early January, and the fishery was closed in late January, when the annual catch limit was reached. Most of the catch is transported live to grow-out pens near the coast of Mexico. Mexico’s National Observer Program (PNAAPD) provided the length-composition data for purse-seine catches during 2016-2021 (Figure A-9).
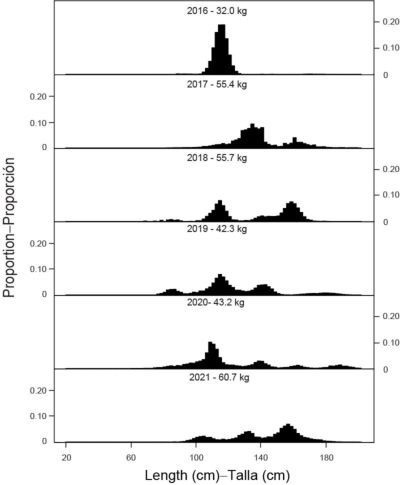 |
| Figure A-9: Estimated length compositions of purse-seine catches of Pacific bluefin tuna, 2016-2021. The length distribution has been standardized as a proportion of the total number of measured tuna in each length interval. The value at the top of each panel is the average weight. Source: Mexico’s National Observer Program (PNAAPD). |
Longline fisheryThe size compositions of yellowfin and bigeye caught by the Japanese longline fleet (commercial and training vessels) in the EPO during 2016-2020 are shown in Figure A-10 and Figure A-11.
 |
| Figure A-10: Estimated size compositions of the catches of yellowfin by the Japanese longline fleet in the EPO, 2016-2020. The size distribution has been standardized as a proportion of the total number of measured tuna in each size range. The value at the top of each panel is the average weight. Source: Fisheries Agency of Japan. |
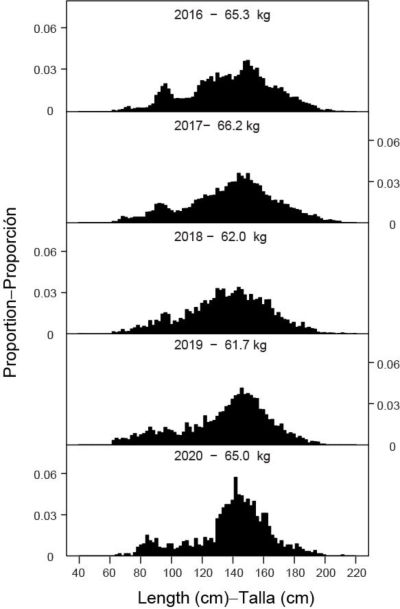 |
| Figure A-11: Estimated size compositions of the catches of bigeye by the Japanese longline fleet in the EPO, 2016-2020. The size distribution has been standardized as a proportion of the total number of measured tuna in each size range. The value at the top of each panel is the average weight. Source: Fisheries Agency of Japan. |
The average annual weight during that period ranged from 36.8 to 61.0 kg for yellowfin, and from 61.7 kg to 66.2 kg for bigeye.
Catches of tunas and bonitos, by flag and gearThe annual retained catches of tunas in the EPO during 1992-2021, by flag and gear, are shown in (
Table A-3a). and, (
Table A-3b). and, (
Table A-3c). and, (
Table A-3d). and, (
Table A-3e).
The purse-seine catches of tunas in 2020 and 2021, by flag and species, are summarized in (
Table A-4a).
Of the nearly 651 thousand t of tunas caught in 2021, 42% were caught by Ecuadorian vessels, and 19% by Mexican vessels. Other countries with significant catches included Panama (12%), Colombia (7%), Venezuela (6%), United States (5%) and Nicaragua (3%). The purse-seine landings of tunas in 2020 and 2021, by species and country of landing, are summarized in (
Table A-4b).
Of the more than 644 thousand t of tunas landed in the EPO in 2021, 64% were landed in Ecuadorian ports, and 20% in Mexican ports. Other countries with landings of tunas in the EPO included Colombia (4%), Peru (1%) and the United States (1%).
Effort
Purse-seine Estimates of the numbers of purse-seine sets of each type (associated with dolphins (DEL), associated with floating objects (OBJ), and unassociated (NOA)) in the EPO during 2006-2021, and the retained catches from those sets, are shown in (
Table A-7) and in Figure 1
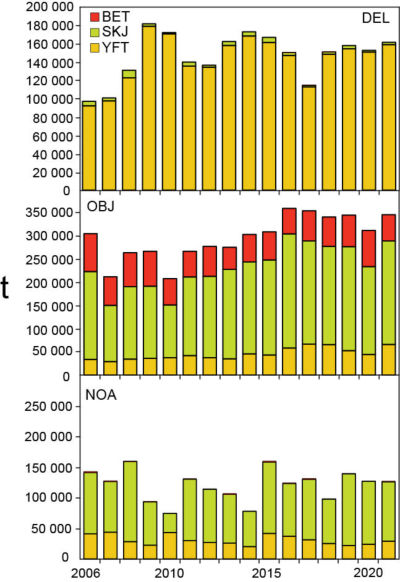 |
| Figure 1: Purse-seine catches of tunas, by species and set type, 2006-2021. |
(The catch data for 2006-2021 incorporate previously unavailable data, and are thus different from the corresponding data presented in previous publications.) The estimates for Class 1-5 vessels (≤363 t carrying capacity) were calculated from logbook data in the IATTC statistical data base, and those for Class-6 vessels from the observer data bases of the IATTC, Colombia, Ecuador, the European Union, Mexico, Nicaragua, Panama, the United States, and Venezuela.
Since the introduction of artificial fish-aggregating devices (FADs) in the mid-1990s, they have become predominant in the floating-object fishery, and now account for an estimated 97% of all floating-object sets by Class-6 vessels (
Table A-8).
Longline The reported nominal fishing effort (in thousands of hooks) by longline vessels in the EPO, and their catches of the predominant tuna species, are shown in (
Table A-9).
Ecosystem Assessment
INTRODUCTIONOver the past two decades, the scope of management of many fisheries worldwide has broadened to take into account the impacts of fishing on non-target species in particular, and the ecosystem generally. This ecosystem approach to fisheries management (EAFM) is important for maintaining the integrity and productivity of ecosystems while maximizing the utilization of commercially-important fisheries resources, but also ecosystem services that provide social, cultural and economic benefits to human society.
EAFM was first formalized in the 1995 FAO Code of Conduct for Responsible Fisheries, which stipulates that “
States and users of living aquatic resources should conserve aquatic ecosystems” and that “management measures should not only ensure the conservation of target species, but also of species belonging to the same ecosystem or associated with or dependent upon the target species”. In 2001, the Reykjavik Declaration on Responsible Fisheries in the Marine Ecosystem elaborated these principles with a commitment to incorporate an ecosystem approach into fisheries management.
The IATTC’s Antigua Convention, which entered into force in 2010, is consistent with these instruments and principles. Article VII (f) establishes that one of the functions of the IATTC is to “
adopt, as necessary, conservation and management measures and recommendations for species belonging to the same ecosystem and that are affected by fishing for, or dependent on or associated with, the fish stocks covered by this Convention, with a view to maintaining or restoring populations of such species above levels at which their reproduction may become seriously threatened”. Prior to that, the 1999 Agreement on the International Dolphin Conservation Program (AIDCP) introduced ecosystem considerations into the management of the tuna fisheries in the EPO. Consequently, for over twenty years the IATTC has been aware of ecosystem issues, and has moved towards EAFM in many of its management decisions (
e.g.,
SAC-10 INF-B; Juan-Jorda et al. 2018). Within the framework of the Strategic Science Plan (SSP), the IATTC staff is conducting novel and innovative ecological research aimed at obtaining the data and developing the tools required to implement EAFM in the tuna fisheries of the EPO. Current and planned ecosystem-related activities by the staff is summarized in the SSP (
IATTC-93-06a) and the Staff Activities and Research report (
SAC-13-01).
Determining the ecological sustainability of EPO tuna fisheries is a significant challenge, given the wide range of species with differing life histories with which those fisheries interact. While relatively good information is available for catches of tunas and billfishes across the entire fishery, this is not the case for most non-target (
i.e., “bycatch”) species, especially those that are discarded at sea or have low economic value (see Data Sources and
IATTC Special Report 25). Furthermore, environmental processes that operate on a variety of time and spatial scales (
e.g., El Niño-Southern Oscillation, Pacific Decadal Oscillation, ocean warming, anoxia and acidification) can influence the abundance and horizontal and vertical distribution of species to different degrees, which in turn affects their potential to interact with tuna fisheries.
Biological reference points, based on estimates of fishing mortality, spawning stock biomass, recruitment, and other biological parameters, have been used for traditional single-species management of target species, but the reliable catch and/or biological data required for determining such reference points, or alternative performance measures, are unavailable for most bycatch species. Similarly, given the complexity of marine ecosystems, there is no single indicator that can holistically represent their structure and internal dynamics and thus be used to monitor and detect the impacts of fishing and the environment.
The staff has presented an
Ecosystem Considerations report since 2003, but in recent years this report has continued to evolve in content, structure, and purpose. Its primary purpose is to complement the annual report on the fishery (
SAC-13-03) with information on non-target species and on the effect of the fishery on the ecosystem, and to describe how ecosystem research can contribute to management advice and the decision-making process. It also describes some important recent advances in research related to assessing ecological impacts of fishing and the environment on the EPO ecosystem and its associated species.
DATA SOURCESIn this report, estimated total catches of bycatch species were obtained from observer data for the large-vessel purse-seine fishery(Size class 6 purse-seine vessels with a carrying capacity >363 t), nominal catches reported by the limited observer coverage onboard the small-vessel purse-seine fishery(Vessels with a carrying capacity <363 t), and gross annual removals by the longline fishery were obtained from data reported by CPCs to the IATTC. Minimum catches in 2020 reported by observers on longline vessels are also included as an interim measure until observer coverage increases to at least 20% that may allow total annual catches for some bycatch species to be reliably estimated. Currently, observer coverage for most CPCs is less than the mandated 5% and are not considered by staff to be representative of the activities of their longline fleets (see Longline below and
BYC-10 INF-D). Longline data were available through 2020 as the deadline for data reporting for the previous year occurs after the annual SAC meeting. Purse-seine data were available through 2021, with data from the last 2 years considered preliminary as of March 2022. Each data source is described in detail below.
Purse-SeineData from the purse-seine fishery is compiled from 3 data sources: 1) IATTC and National Program observer data, 2) vessel logbook data extracted by staff at the Commission’s field offices in Latin American tuna ports, and 3) cannery data. The observer data from the large-vessel (Class 6) fishery are the most comprehensive in terms of bycatch species. An historical perspective of bycatch data collection from the observer programs was recently published and is described in
IATTC Special Report 25. Observers of the IATTC and the various National Programs provide detailed bycatch data by species, catch, disposition and effort for the exact fishing position (
i.e., the latitude and longitude of the purse-seine set). Both the fisher-completed logbook and cannery datasets contain very limited data on bycatch species as reporting is primarily focused on commercially important tuna species. The logbook data, like the purse seine, includes the exact fishing position, but limited effort data are recorded with only one entry per day, regardless of the number of sets made. The cannery (or “unloading”) data do not have an exact fishing position but rather a broad geographic region where fish were caught (
e.g., the eastern Pacific or western Pacific Ocean). These data contain bycatch species only if they were retained in a purse-seine well during the fishing operation.
Smaller (Class 1-5) purse-seine vessels are not systematically required to carry observers, except under specific circumstances (
e.g., certification purposes, fishing during closure periods). The primary sources of unobserved data are logbook records, cannery unloading records, and port sampling by IATTC field office staff, all of which focus on tuna species. The FAD form, a logbook designed in late 2018 to be used by skippers of small vessels fishing on FADs, is also a source of unobserved data for tunas and sensitive species groups, but bycatch data is currently of little use for the purposes of this report as data are aggregated into broad taxonomic groups and data quality is uncertain. As such, there is limited information recorded on interactions with bycatch species by smaller vessels. In recent years there has been an increase in the number of smaller vessels that have carried observers. This is due to AIDCP requirements for fishing during closure periods for Class 6 purse-seine vessels, a desire for dolphin-safe fishery certification, an IATTC pilot project trialing the efficacy of electronic monitoring methodologies (
SAC-11-10), and a voluntary observer program for smaller vessels established by the Tuna Conservation Group (TUNACONS)–a consortium of Ecuadorian tuna fishing companies–that began in 2018. The minimum observer-derived catch reported by observers for bycatch species by small vessel trips are included in this report (Table L-8) to provide the basic information currently available for this fishery, with a view to expanding reporting on this fishery as data provision is hoped to improve in future. In 2021, most trips (73%) made by smaller vessels were unobserved, 19% were from the voluntary TUNACONS observer program, 6% from the Ecuadorian National Observer program and 2% from the IATTC observer program.
Therefore, in this report we primarily focus on the comprehensive observer dataset from large purse-seine vessels to provide catch estimates for bycatch species. Under the AIDCP program, an observer is placed on a large purse-seine vessel prior to each trip. The bycatch data provided by the observers is used to estimate total catches, by set type (
i.e., floating objects (OBJ), unassociated tunas (NOA), and dolphins (DEL))
3. The numbers of sets of each type made in the EPO during 2006–2021 are shown in Table A-7 of Document
SAC-13-03. Despite the observer requirement, some sets are known to have taken place, based on logbooks and other sources, but were not observed. For example, at the start of bycatch data collection in 1993, about 46% of sets were observed, increasing to 70% in 1994. From 1994 to 2008, the average percent of sets observed was around 80%. From 2009 onwards, nearly 100% of sets were observed. Catch-per-day data for both target and non-target bycatch species are extrapolated. The observed data is aggregated by species, year, flag and set type. The number of known unobserved sets is taken from logbooks and other sources. Additionally, there are known EPO trips for which the staff do not know the number and type of sets made. Therefore, known bycatch-per-day from observer data is calculated by species, year, flag and set type, and applied to the number of
days-at-sea for each trip to estimate the bycatch. In some instances, there may be unobserved sets or days-at-sea data by a flag that have no equivalent observer data for that year to facilitate a reliable estimation of catch. For these trips, yearly data from a proxy flag is used. The proxy flag is determined by subsequent 5 trips made by the vessel where an observer was onboard, and adopting the predominant flag used for those trips as the proxy flag. Then the bycatch-per-set or day of the known proxy flag for the year in question is applied to the data for the unrepresented flag.) to account for such instances.
LonglineThe considerable variability in reporting formats of longline data has hindered the staff’s ability to estimate EPO-wide catches for bycatch species (
SAC-08-07b,
SAC-08-07d,
SAC-08-07e,
BYC-10 INF-D). Bycatch data for longline fisheries reported here were obtained using data of gross annual removals estimated by each CPC and reported to the IATTC in summarized form. Because there is uncertainty in whether the IATTC is receiving all bycatch data from the longline fishery of each CPC, these data are considered incomplete, or ‘sample data’, and are therefore regarded as minimum annual reported catch estimates for 1993–2020. A staff-wide collaboration is underway to update the data provision Resolution
C-03-05 to improve the quality of data collection, reporting, and analysis to align with IATTC’s responsibilities set forth in the Antigua Convention and the SSP
(SAC-12-09). A preliminary objective of this work is to initiate a series of collaborative workshops between the staff and CPCs to assess the feasibility of collecting desirable data types and develop data collection templates for each gear type, with clear standards and procedures for data submission that will explicitly include interactions with bycatch species.
During this process, the staff were able to determine that the longline catches of sharks, reported by CPCs were several times higher than previously reported catches for the longline fishery. A review of the data revealed that a high proportion of shark catches were assigned to “other gears” in the annual
Fishery Status Reports since 2006 but were in fact taken by longline by coastal CPCs. Therefore, the resulting transfer of catch data from “other gears” to “longline” significantly increased the longline catches of sharks from 2006 onwards (see Table A2c in
SAC-11-03).
Longline observer data reporting for longline vessels >20 m has been improving since Resolution
C-19-08 entered into force. The staff has received detailed set-by-set operational level observer data for several CPCs, although the level of observer coverage has often been less than the current mandated coverage of 5% of the total number of hooks or “effective days fishing”. Furthermore, for most CPCs, the coverage is significantly lower than the 20% coverage recommended by the staff, the Working Group on Bycatch, and the Scientific Advisory Committee. The effectiveness of the mandated 5% observer coverage for assessing whether the observer coverage is representative of the activities of the total fleet is presented in
BYC-10 INF-D. Although CPCs made a tremendous effort in improving their reporting of longline observer data, results from the analysis showed that 5% observer coverage is insufficient for estimating the total catch of the relatively data-rich yellowfin and bigeye tunas, and so catch estimates for bycatch species are likely to be less reliable given that less data are available for these species. IATTC staff will seek to provide estimates of longline catches in the EPO based on observer data in the future, but the results of the aforementioned analyses highlight a clear need for data reporting of bycatch species to improve (see
SAC-12-09).
FISHERY INTERACTIONS WITH SPECIES GROUPS TUNAS AND BILFISHESData on catches of the principal species of tunas and bonitos of the genera
Thunnus,
Katsuwonis,
Euthynnus, and
Sarda, and of billfishes in the Istiophoridae and Xiphiidae families, are reported in Document
SAC-13-03. An investigation on the effects of the COVID-19 pandemic on the catches of tropical tunas is provided in
SAC-13-05. The staff has developed
stock assessments and/or stock status indicators (SSIs) for tropical tunas (
SAC-13-06), an interim skipjack assessment (
SAC-13-07), a spatio-temporal tagging model for skipjack (
SAC-13-08), and a fisheries independent abundance index for skipjack using echo-sounder buoy data for the OBJ fishery
(FAD-06-03). The staff has also collaborated in the assessments of
Pacific bluefin and
albacore tunas led by the International Scientific Committee for Tuna and Tuna-like Species in the North Pacific Ocean (ISC), the assessment of
south Pacific albacore tuna led by the Western and Central Pacific Fisheries Commission (WCPFC), and collaborated on the ISC assessments for north Pacific
swordfish (2018),
blue marlin (2019) and
striped marlin (2019 and 2022). A southern EPO swordfish benchmark assessment is provided in
SAC-13-09.
Marine mammalsMarine mammals, especially spotted dolphins (
Stenella attenuata), spinner dolphins (
S. longirostris), and common dolphins (
Delphinus delphis), are frequently associated with yellowfin tuna in the EPO. Purse-seine fishers commonly set their nets around herds of dolphins and the associated yellowfin tuna, and then release the dolphins while retaining the tunas. The incidental mortality of dolphins was high during the early years of the fishery, but declined dramatically in the early 1990s, and has remained at low levels thereafter (
AIDCP-43-02; Figure L-1).
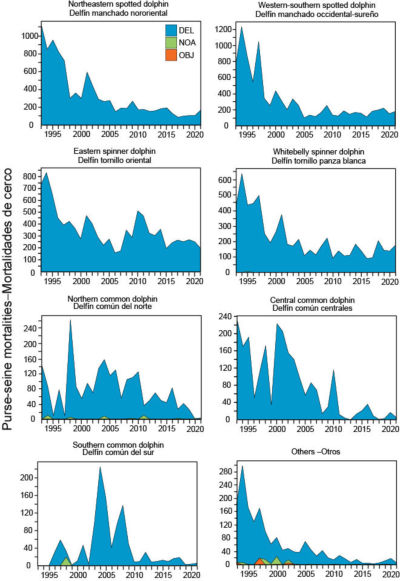 |
| Figure L-1: Estimated number of incidental dolphin mortalities by observers onboard purse-seine vessels, 1993–2021. |
Estimates of incidental mortality of dolphins in the purse-seine fishery of large vessels during 1993–2021 are shown in Table L-1a. (
Table L-1a). In 2021, the stock of dolphins with the highest incidental mortality was the eastern spinner (
n=197), followed by the western-southern spotted (
n=178), whitebelly spinner (
n=175), and northeastern spotted dolphins (
n=167). Common dolphins were least impacted by the fishery, with mortalities of 3 northern, 6 central, and 5 southern common dolphins. The staff plans to analyze available reported and observed marine mammal interaction data for the purse-seine fisheries in the near future.
In recent years significant improvements have been made to the minimum data standards of longline observer data submitted to the IATTC, which now require submission of operational level data under Resolution
C-19-08. However, as discussed in longline section the low level of observer coverage (at least 5%) currently mandated for these vessels is not representative of the different fleet components and hinders the extrapolation of observed data to generate fleet totals (see
BYC-10 INF-D). For the time being, only the minimum number of observed interactions and mortalities reported for marine mammals is presented for 2020 (Table L-1b). (
Table L-1b:).
Interactions and mortalities were defined by subjective classification of fate (injured, released, or not reported) and release condition (alive and healthy or not reported) as recorded by observers. Dispositions not reported were precautionarily assumed to represent mortalities. Under these assumptions, all marine mammals reported by observers were considered to be mortalities with the exception of a small unidentified whale that was released “alive and healthy”. The staff reiterates that the level of observer coverage should be increased to at least the recommended 20% to help facilitate expansion of the number of interactions and mortalities to the total fleet activities for marine mammals and other vulnerable bycatch species.
Sea turtles Sea turtles are occasionally caught in the purse-seine fishery in the EPO, usually when associated with floating objects that are encircled, although they are sometimes also caught by happenstance in sets on unassociated tunas or tunas associated with dolphins. They can also become entangled in the webbing of fish-aggregating devices (FADs) and drown or be injured or killed by fishing gear.
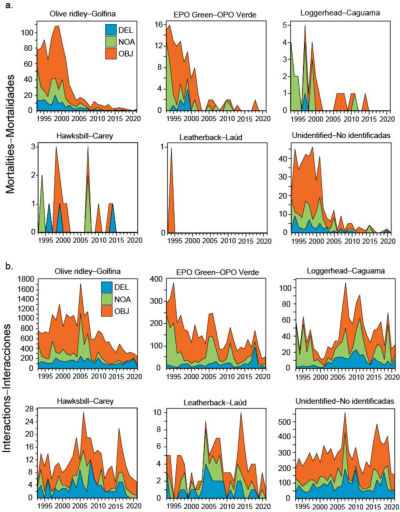 |
| Figure L-2: Estimated number of sea turtle a) mortalities and b) interactions by observers onboard large purse-seine vessels, 1993–2021, by set type (dolphin (DEL), unassociated (NOA), floating object (OBJ)). |
Figure L-2 shows the number of estimated sea turtle mortalities and interactions recorded by observers on large purse-seine vessels, by set type, during 1993–2021. Interactions were defined from observer information recorded as fate on the dedicated turtle form as: entangled, released unharmed, light injuries, escaped from net, observed but not involved in the set and other/unknown. The olive Ridley turtle (
Lepidochelys olivacea) is, by far, the species of sea turtle most frequently caught, with a total of 21,680 interactions and 951 mortalities (~4%) during 1993–2021, but only 245 interactions (2 mortalities) in 2021 (Table L-2a). (
Table L-2a). In 2021, there were 52 interactions recorded with eastern Pacific green, 29 loggerhead, 5 hawksbill, 1 leatherback, and 153 unidentified turtles and no mortalities.
In the longline fishery, sea turtles are caught when they swallow a baited hook, are accidentally hooked, or drown after becoming entangled in the mainline, floatlines or branchlines and cannot reach the surface to breathe. They are also caught in coastal pelagic and bottom-set gillnet fisheries, where they become enmeshed in the net or entangled in the floatlines or headrope. Although very few data are available on incidental mortality of turtles by longline and gillnet fishing, the mortality rates in the EPO industrial longline fishery are likely to be lowest in “deep” sets (around 200–300 m) targeting bigeye tuna and albacore, and highest in “shallow” sets (<150 m) targeting swordfish. There is also a sizeable fleet of artisanal longline and gillnet fleets from coastal nations that are known to catch sea turtles, but limited data are available (see
BYC-11-02).
Data on sea turtle interactions and mortalities in the longline fishery have not been available (
SAC-08-07b), although they are beginning to improve with the submission of operational-level observer data since 2019 pursuant to Resolution
C-19-08. Recalling the observer coverage for most longline vessels is 5% or less (see
BYC-10 INF-D), compared to 100% of observed trips in the large-vessel purse-seine fishery, the observer data provided by CPCs for 2020 are considered minimum numbers of interactions and mortalities (Table L-2b).(
Table L-2b). Here interactions and mortalities were defined by fate (discarded, injured, grave injuries, released, released with hook, or not reported) and/or release condition (alive and healthy, alive and injured, dead, unknown, or not reported) as recorded by observers. The reported interactions in 2020 were highest for leatherback turtles (43%) but of the 10 interactions, 7 were released alive. The staff hopes to use the new operational observer data submissions required under
C-19-08 to report the first total longline fleet catch estimate for sea turtle species in the future, although
BYC-10 INF-D cautions that the current 5% observer coverage is insufficient for producing reliable estimates of total catch.
Various IATTC resolutions, most recently
C-19-04, have been intended to mitigate fishing impacts on sea turtles and establish safe handling and release procedures for sea turtles caught by purse-seine and longline gears. Additionally, a “circle hook” workshop was held prior to the 13
th SAC meeting to discuss a) the effects of different sizes of circle hooks on mitigating bycatch of sea turtles and other vulnerable species in the longline fishery and b) the minimum hook size to satisfy the requirements outlined in Resolution
C-19-04. The workshop participants discussed the use of different circle hooks in longline fisheries to satisfy C-19-04, with minimum width of the hook defined on a fishery specific basis and dependent upon the target species. However, no definitive conclusions or recommendation have been made (
WSHKS-01), although discussions were resumed during the 11
th Bycatch Working Group meeting, in May 2022.
A preliminary vulnerability assessment was conducted in collaboration with the Inter-American Convention for the Protection and Conservation of Sea Turtles (IAC) for the eastern Pacific stock of leatherback turtles for 2018, using the Ecological Assessment of Sustainable Impacts of Fisheries (EASI-Fish) approach (see Identification of Species at Risk section) (
BYC-10 INF-B). The vulnerability status of the stock was determined to be “most vulnerable” in 2018. The staff has continued to collaborate with IAC in 2020–2022 to improve the species distribution model (
BYC-11-01) and vulnerability assessment using updated fisheries data from coastal CPCs (
BYC-11-02). The finalized assessment showed that the vulnerability status of the stock remained as “most vulnerable” in 2019. Modelling of 70 management scenarios showed that the implementation of improved handling and release practices by industrial and artisanal fleets, or use of circle hooks, or use of fish bait by longline fleets could reduce at-vessel and/or post-release mortality to an extent where the population might recover to a status of “least vulnerable”, assuming fishing effort levels of all EPO fisheries do not increase. The use of these three measures in concert was predicted to even further reduce vulnerability. Detailed results from this work were presented in 2022 at the Bycatch Working Group meeting (
BYC-11-01,
BYC-11-02).
SeabirdsThere are approximately 100 species of seabirds in the tropical EPO. Some of them associate with epipelagic predators, such as fishes (especially tunas) and marine mammals, near the ocean surface; for some, feeding opportunities are dependent on the presence of tuna schools feeding near the surface. Some seabirds, especially albatrosses and petrels, are caught on baited hooks in pelagic longline fisheries.
The IATTC has adopted one resolution on seabirds (
C-11-02); also, the Agreement on the Conservation of Albatrosses and Petrels (ACAP) and BirdLife International have updated their maps of seabird distribution in the EPO, and have recommended guidelines for seabird identification, reporting, handling, and mitigation measures (
SAC-05 INF-E,
SAC-07-INF-C(b),
SAC-08-INF-D(a),
SAC-08-INF-D(b), BYC-08 INF J(b)). Additionally, ACAP has reported on the conservation status of albatrosses and large petrels (
SAC-08-INF-D(c);
BYC-08 INF J(a)). Participants in the circle hook workshop, held in March 2022, discussed the influence of circle hooks on seabird capture and mortality (
WSHKS-01). The available data seem to be inconclusive to comment on any conservation value of circle hooks over other hook shapes or sizes to seabirds given a lack of empirical studies.
As with sea turtles, data on seabird interactions and mortalities in the longline fishery have been unavailable (
SAC-08-07b), but with the submission of operational-level observer data for longline vessels >20 m beginning in 2019 some minimum estimates for 2020 are available for reporting (Table L-3).(
Table L-3).
The observer data submitted by CPCs for 2020 contained 126 interactions with seabirds—all recorded as “discarded”, “injured” or precautionarily presumed dead due to incomplete disposition data. With these limited data, Laysan albatross,
Phoebastria immutabilis, was reported to have interacted the most with the gear (29% of all interactions). The staff hopes to report the first total longline fleet catch estimate for seabird species in the future using the operational observer data as improvements in data collection continue—but see
BYC-10 INF-D for a discussion on the current inadequacy of longline observer data for expanding data to the activities of the longline fleet to provide estimates of total catch.
Sharks Sharks are caught as bycatch in EPO tuna purse-seine fisheries and as either bycatch or a target in longline and multi-species and multi-gear fisheries of the coastal nations.
Stock assessments or stock status indicators (SSIs) are available for only four shark species in the EPO: silky (Carcharhinus falciformis) (Lennert-Cody et al. 2018;
BYC-10 INF-A,
BYC-11 INF-B), blue (Prionace glauca) (
ISC Shark Working Group), shortfin mako (Isurus oxyrinchus) (
ISC Shark Working Group), and common thresher (Alopias vulpinus) (
NMFS). As part of the
FAO Common Oceans Tuna Project, Pacific-wide assessments of the porbeagle shark (Lamna nasus) in the southern hemisphere (Clarke 2017) and the bigeye thresher shark (Alopias superciliosus) (Fu et al. 2018) were completed in 2017, and for the silky shark (Clarke 2018a) in 2018, as well as a risk assessment for the Indo-Pacific whale shark population (Clarke 2018b) also in 2018. Whale shark interactions with the tuna purse-seine fishery in the EPO are summarized in document
BYC-08 INF-A. The impacts of tuna fisheries on the stocks of other shark species, not previously mentioned, in the EPO are unknown. The first quantitative vulnerability assessment of shark bycatch for EPO industrial and artisanal fisheries—using the EASI-Fish methodology (see Identification of Species at Risk section)—was completed in 2022 and was presented at SAC-13 (
SAC-13-11). Briefly, a total of 49 shark species were recorded to interact with EPO tuna fisheries, of which 32 species were formally assessed using EASI-Fish for 2019. Overall, 20 species were classified as “most vulnerable”, including hammerhead sharks (4 species), requiem sharks (10 species), threshers (
Alopias superciliosus and
A. pelagicus), mesopelagic sharks (3 species) and the commercially important blue shark (
Prionace glauca) and shortfin mako (
Isurus oxyrinchus). The remaining 12 species were classified as “least vulnerable” (9 species) or “increasingly vulnerable” (3 species). The report recommended further analysis to explore a range of potential hypothetical conservation and management measures (CMMs) that may be implemented—in isolation or in combination—within the EPO to reduce fishery impacts on particularly vulnerable shark species identified, including silky, thresher and hammerhead sharks.
Catches (t) of sharks in the large-vessel purse-seine fishery (1993–2021) and minimum reported catch estimates(Sharks caught by longline vessels are recorded using different weight metrics (
e.g., round, trunk or whole weight) and thus, total annual reported catch estimates may contain a mix of these weight metrics. The staff is working on harmonizing shark data collection to improve the reliability of total catch estimates (
e.g., SAC-11-13).) by longline fisheries (1993–2020) are provided in Table L-4a (
Table L-4a).
while catches of the most frequently caught species, are shown in Figure L-3.
 |
| Figure L-3: Estimated catches in metric tons (t) of key shark species in the eastern Pacific Ocean recorded by observers onboard large purse-seine vessels and minimum longline (LL) estimates of gross annual removals reported by CPCs (see longline section for uncertainty in reporting of bycatch species caught by longline). Purse-seine catches are provided for size-class 6 vessels with a carrying capacity >363 t (1993–2021) by set type: floating object (OBJ), unassociated tuna schools (NOA) and dolphins (DEL). Longline catches (1993–2020) are minimum reported gross-annual removals that may have been estimated using a mixture of different weight metrics (Sharks caught by longline vessels are recorded using different weight metrics (e.g., round, trunk or whole weight) and thus, total annual reported catch estimates may contain a mix of these weight metrics. The staff is working on harmonizing shark data collection to improve the reliability of total catch estimates (e.g., LINK Word.Document.12 \\\\fileserver1\\shared\\databases\\TunaPublic\\FIRMSProject\\FSRUploadsToFirms\\2022\\TunaAndBillfishes2022.docx OLE_LINK2 \a \h \* MERGEFORMAT SAC-11-13)). |
Reporting of many shark species by longline gear began in 2006. The silky shark (family Carcharhinidae) is the species of shark most commonly caught in the purse-seine fishery with annual catches averaging 554 t—primarily from sets on floating objects (Figure L-3)—and being 571 t in 2021. In contrast, minimum reported annual catch in the longline sample data for 2006–2020 averaged 11,395 t and was 14,752 t in 2020. Annual catch for the oceanic whitetip shark (Carcharhinidae) in the purse-seine fishery averaged 58 t (also primarily from sets on floating objects) and was 12 t in 2021. The minimum reported annual catch in the longline fishery from 2006–2020 averaged 143 t and none were reported in 2020. Catches of oceanic whitetip have declined in the purse-seine fishery since the early 2000s, while catches have been variable in the longline fishery (Figure L-3). Minimum annual reported catch of blue shark in the longline fishery from 1993–2020 averaged 6,134 t and was 15,080 t in 2020. By contrast, the annual catch in the purse-seine fishery averaged only 2 t, with 1 t caught in 2021.
Other important species of sharks caught in the purse-seine and longline fisheries include the smooth hammerhead (
Sphyrna zygaena), the pelagic thresher (
Alopias pelagicus), and mako sharks (
Isurus spp.) (Table L-4a, Figure L-3). Catch estimates for the smooth hammerhead shark in the purse-seine fishery averaged 26 t (primarily caught in floating-object sets) and was 13 t in 2021, while in the longline fishery minimum annual reported catch averaged 958 t (2006–2020) and was 941 t in 2020. In contrast, the pelagic thresher was caught primarily in unassociated tuna school sets in the purse-seine fishery with the estimated annual catch averaging 5 t and was 1 t in 2021. Minimum annual reported catch of the pelagic thresher in the longline fishery averaged 2,066 t (2007–2020) and was 342 in 2020. Catch estimates for the mako sharks in the purse-seine fishery were lower than the aforementioned shark species averaging 3 t and was 2 t in 2021. However, in the longline fishery the minimum annual reported catch averaged 1,419 t (1993–2020) and was 3,694 t in 2020.
The limited observer data from small purse-seine vessels showed 17 t of silky shark and 4 t of scalloped hammerhead were caught in floating-object sets in 2021, while those of other shark species or species groups were minimal (≤3 t) (Table L-8). (
Table L-8).
The minimum catches—derived only from observer data—for sharks caught by longline in 2020 are presented in Table L-4b (see longline section and
BYC-10 INF-D for uncertainties in data reporting by longline gear). (
Table L-4b). Blue shark was by far the most frequently caught shark species in this dataset with over 70,000 animals reported to have interacted with the gear in 2020, followed by the silky shark with over 10,000 animals. Under the disposition criteria described in Table L-4b, nearly all interactions resulted in mortalities for most of the shark species and species groups reported by observers.
The artisanal longline fisheries of the coastal CPCs target sharks, tunas, billfishes and dorado (
Coryphaena hippurus), and some of these vessels are similar to industrial longline fisheries in that they operate in areas beyond national jurisdictions (Martínez-Ortiz
et al. 2015). However, essential shark data from these longline fisheries are often lacking, and therefore conventional stock assessments and/or stock status indicators cannot be produced (see data challenges outlined in
SAC-07-06b(iii)). A project was undertaken to improve data collection on sharks, particularly for Central America, for the longline fleet through funding from the Food and Agriculture Organization of the United Nations (FAO) and the Global Environmental Facility (GEF) under the framework of the ABNJ Common Oceans program (
SAC-07-06b(ii), SAC-07-06b(iii)). A one-year pilot study was conducted in 2019, collecting shark-fishery data and developing and testing sampling designs for a long-term sampling program for the shark fisheries throughout Central America (Phase 2 of the project). A progress report on the FAO-GEF ABNJ project was presented at SAC-11 (
SAC-11-13). Although this pilot study in Central America has now been completed, the sampling methodology will be applied in a second phase of the FAO-GEF ABNJ project in other IATTC Members will begin in 2022 (SAC-13-12). Data obtained from these projects may be included in future iterations of this report to provide improved catch estimates, albeit minimum estimates, for sharks by the various longline, gillnet and mixed gear fleets.
RaysEstimated annual catches of manta rays (Mobulidae) and stingrays (Dasyatidae) by the large-vessel purse-seine (1993–2021) and minimum reported annual catches by longline (1993–2020) fisheries are provided in (
Table L-5a) while catches of key species are shown in (Figure L-4).
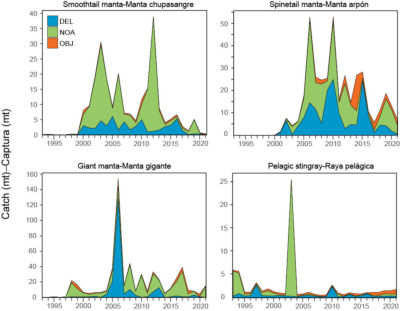 |
| Figure L-4: Estimated purse-seine catches in metric tons (t) of key species of rays in the eastern Pacific Ocean. Purse seine catches are provided for size-class 6 vessels with a carrying capacity >363 t (1993–2021) by set type: floating object (OBJ), unassociated tuna schools (NOA) and dolphins (DEL). |
These rays are primarily caught by the purse-seine fishery, while limited catches were reported for the longline fishery only for the Munk’s devil ray (2009: 6 t, 2010: 118 t) and Dasyatidae spp. (15 t over a 5-year period), with half the catches made in 2009 (Table L-5a). The giant manta had the largest average catches in the purse-seine fishery (19 t), followed by the spinetail (14 t), and smoothtail (8 t) mobulid rays. Catches of these species in 2021 were 15, 7, and <1 t, respectively. Catches of the pelagic stingray were low, averaging only 2 t and being 2 t in 2021 (Table L-5a). Although catches of these rays can be variable by set type, they have been highest in unassociated sets, followed by dolphin sets, and lowest in floating-object sets (Figure L-4).
For the small purse-seine vessel fishery, the limited available observer data for 2021 was minimal (≤1 t) for all other ray species or species groups (Table L-8).
The minimal data available from the longline observer dataset (see longline section and
BYC-10 INF-D) showed that the most interactions were with the pelagic stingray (
Pteroplatytrygon violacea) and 91% of these interactions (4,332 individuals) resulted in mortalities (3,960) (Table L-5b) (
Table L-5b).
The vulnerability status and efficacy of potential conservation and management measures (CMMs) for the spine-tail devil ray (Mobula mobular) impacted by industrial purse-seine and longline fisheries in the EPO was determined using the EASI-Fish methodology (see Identification of Species at Risk section) (Griffiths and Lezama-Ochoa 2021). In the assessment year of 2018, the estimated fishing mortality exceeded the F/F
40% and SBR/SBR
40% biological reference point, leading to a vulnerability status classification of “most vulnerable”. A retrospective analysis of vulnerability from 1979–2018 showed the species to be classified as “least vulnerable” between 1979 and 1993, but became “most vulnerable” from 1994, which coincided with the rapid spatial expansion of the industrial purse-seine fishery. Vulnerability increased significantly from 2011 following the rapid increase in the number of purse-seine sets made on floating objects to 2018. Simulating the CMMs in place in 2018 for EPO tuna fisheries (i.e., an EPO-wide closure) and for mobulids specifically (i.e., use of best handling and release practices under
C-15-04) resulted in 31 of the 45 scenarios changing the classification of the species from “most vulnerable” to “least vulnerable”, which primarily involved a reduction of post-capture mortality by as little as 20%. Implementing appropriate best handling and release practices can be a reasonably simple, rapid and cost-effective conservation measure, but a recommendation from the work was to extend the EASI-Fish analysis to all species of mobulids impacted by EPO tuna fisheries, improve estimates of post-release mortality for these species through dedicated tagging studies, and improve species-specific catch reporting, especially in artisanal fisheries, to improve the reliability of outputs from EASI-Fish assessments.
Other large fishesLarge pelagic fishes caught by the large-vessel purse-seine, primarily on floating-object sets, (1993–2021) and longline (1993–2020) fisheries are shown in Table L-6a, (
Table L-6a) with time series of catches of key species presented in Figure L-5.
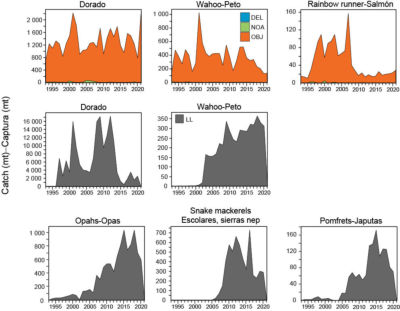 |
| Figure L-5 Estimated purse-seine and longline catches in metric tons (t) of key species of large fishes in the eastern Pacific Ocean. Purse-seine catches are provided for size-class 6 vessels with a carrying capacity >363 t (1993–2021) by set type: floating object (OBJ), unassociated tuna schools (NOA) and dolphins (DEL). Longline (LL) catches (1993–2020) are minimum reported gross-annual removals. |
The most commonly-caught pelagic fishes in both fisheries is dorado (Coryphaenidae) with the estimated average annual catch for the purse-seine fishery being 1,323 t (2,217 t in 2021) and the minimum reported annual catch for the longline fishery averaging 5,928 t (2,506 t in 2020). Dorado is also one of the most important species caught in the artisanal fisheries of the coastal nations of the EPO (
SAC-07-06a(i)). Recommendations for potential reference points and harvest control rules for dorado in the EPO were presented at SAC-10
(SAC-10-11).
Other key species caught by the purse-seine fishery include wahoo (Scombridae) and rainbow runner (Carangidae). Wahoo had an estimated average annual catch of 369 t for the purse-seine fishery, although catches have declined from a peak of 1,025 t in 2001 to 133 t in 2021 (Figure L-5). Minimum reported annual catch of wahoo by the longline fishery have averaged 168 t and was 311 t in 2020. No catches of rainbow runner have been reported by the longline fishery. However, in the purse-seine fishery, estimated average annual catches of rainbow runner were 47 t, with the peak catch in 2007 at 158 t and declining thereafter to 29 t in 2021 (Figure L-5).
Pelagic fishes commonly reported by the longline fishery include opah (Lampridae), snake mackerels (Gempylidae) and pomfrets (Bramidae). Minimum reported annual catches for these species averaged 358 t (1993–2020), 367 t (2006–2020), and 49 t (1993–2020), respectively. Catches of all these taxa have increased after the mid-2000s (Figure L-5). For the most recent year (2020), there were 597 t, 288 t, and 70 t of opah, snake mackerels, and pomfrets reported, respectively (Table L-5a).
The limited observer data available for 2021 for the small purse-seine fishery included 158 t of dorado and 13 t of wahoo caught in floating-object sets, while the remaining species or species groups of large fishes had ≤1 t reported (Table L-8).
For 2020, the minimal available data from longline observers (see longline section and
BYC-10 INF-D) is provided in Table L-6b (
Table L-6b) and shows the most frequently caught species in this dataset was the long snouted lancetfish (
Alepisaurus ferox) with about 14,000 interactions. Most interactions with large fishes resulted in mortalities.
Forage speciesA large number of taxa occupying the middle trophic levels in the EPO ecosystem—generically referred to as “forage” species—play a key role in providing a trophic link between primary producers at the base of the food web and the upper-trophic-level predators, such as tunas and billfishes. Some small forage fishes are incidentally caught in the EPO by purse-seine vessels on the high seas, mostly in sets on floating objects, and by coastal artisanal fisheries, but are generally discarded at sea. Catches of these species are presented in (
Table L-7) with key species as identified by catch data presented in Figure L-6 for the large-vessel purse-seine fishery, with the majority of catches coming from floating object sets.
Bullet and frigate tunas (Scombridae) are by far the most commonly reported forage species with estimated annual catches averaging 1,032 t from 1993–2021. However, their catches have declined from 1,922 in 2005 to 442 t in 2021 (Figure L-6).
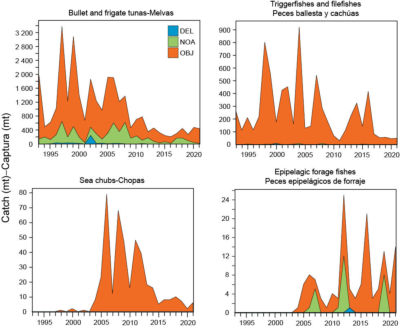 |
| Figure L-6: Estimated purse-seine catches in metric tons (t) of key species of small fishes in the eastern Pacific Ocean. Purse seine catches are provided for size-class 6 vessels with a carrying capacity >363 t (1993–2021) by set type: floating object (OBJ), unassociated tuna schools (NOA) and dolphins (DEL). |
Triggerfishes (Balistidae) and filefishes (Monacanthidae) are the second most commonly reported forage group with annual estimated catches averaging 253 t and totaling 50 t in 2021. Catches for this group peaked in 2004 at 922 t but have otherwise been variable. Annual catches of sea chubs (Kyphosidae) have averaged 16 t, which began to increase after 2002 but have remained low since 2015 with 6 t in 2021. Lastly, annual catches of the various species in the category ‘epipelagic forage fishes’ averaged 5 t with 14 t estimated to be caught in 2021. A total of 104 t of bullet and frigate tunas and 4 t of triggerfishes and filefishes were reported by observers on the limited number of trips on small purse-seine vessels that carried an observer in 2021. Catches of all other species or species groups of small fishes were minimal (<1 t) (Table L-7).
PHYSICAL ENVIRONMENTEnvironmental conditions affect marine ecosystems, the dynamics and catchability of target and bycatch species, and the activities of fishers, and biophysical factors can have important effects on the distribution and abundance of marine species (see
SAC-04-08,
Physical Environment, and
SAC-06 INF-C for a comprehensive description of the effects of physical and biological oceanography on tunas, prey communities, and fisheries in the EPO.)(
e.g., SAC-10 INF-D). The following summary of the biophysical environment covers: 1) short- and long-term environmental indicators, and 2) environmental conditions and their potential effect on the fishery during the previous year, in this case, 2021.
Environmental indicatorsThe ocean environment changes on a variety of time scales, from seasonal to inter-annual, decadal, and longer. Longer-term climate-induced changes, typically decadal (at intervals of 10–30 years) and characterized by relatively stable average conditions and patterns in physical and biological variables, are called “regimes”. However, the dominant source of variability in the upper layers of the EPO is the El Niño-Southern Oscillation (ENSO), an irregular fluctuation involving the entire tropical Pacific Ocean and the world’s atmosphere (Fiedler 2002). El Niño events occur at two- to seven-year intervals, and are characterized by weaker trade winds, deeper thermoclines, and higher sea-surface temperatures (SSTs) in the equatorial EPO. El Niño’s opposite phase, commonly called La Niña, is characterized by stronger trade winds, shallower thermoclines, and lower SSTs. The changes in the biogeochemical environment caused by ENSO have an impact on the biological productivity, feeding, and reproduction of fishes, seabirds, and marine mammals (Fiedler 2002).
ENSO is thought to cause considerable variability in the availability for capture of commercially-important tunas and billfishes in the EPO (Bayliff 1989). For example, the shallow thermocline during a La Niña event can increase purse-seine catch rates for tunas by compressing the preferred thermal habitat of small tunas near the sea surface, while the deeper thermocline during an El Niño event likely could make tunas less vulnerable to capture, and thus reduce catch rates. Furthermore, warmer- or cooler-than-average SSTs can also cause the fish to move to more favorable habitats, which may also affect catch rates as fishers expend more effort on locating the fish.
Recruitment of tropical tunas in the EPO may also be affected by ENSO events. For example, strong La Niña events in 2007–2008 may have been partly responsible for the subsequent lower recruitment of bigeye tuna, while the largest recruitments corresponded to the extreme El Niño events in 1982–1983 and 1998 (
SAC-09-05). Yellowfin recruitment was also low in 2007, but high during 2015–2016, after the extreme El Niño event in 2014-2016 (
SAC-09-06).
The
Climate Diagnostics Bulletin of the US National Weather Service reported that in 2021 anomalies—defined in the Bulletin as a departure from the monthly mean—in oceanic and atmospheric characteristics (
e.g., surface and sub-surface temperatures, thermocline depth, wind, and convection) were indicative of La Niña conditions during January–March, ENSO-neutral conditions during April–August and La Niña conditions during September–December.
Indices of variability in such conditions are commonly used to monitor the direction and magnitude of ENSO events in the Pacific Ocean. In this report, the Oceanic Niño Index (ONI), used by the US National Oceanic and Atmospheric Administration (NOAA) as the primary indicator of warm El Niño and cool La Niña conditions within the Niño 3.4 region in the east-central tropical Pacific Ocean (Dahlman 2016) (Figure L-7).
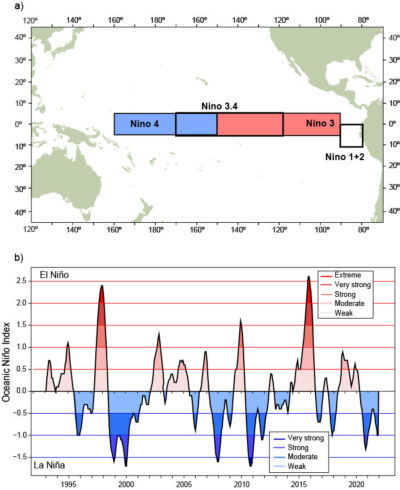 |
| Figure L-7: El Niño regions used as indicators of El Niño Southern Oscillation (ENSO) events in the Pacific Ocean (top panel), and the Oceanic Niño Index (ONI) used to monitor ENSO conditions in Niño region 3.4 from 5°N to 5°S and 120°W to 170°W (bottom panel). Time series shows the running 3-month mean ONI values from the start of the IATTC observer program through December 2021. ONI data obtained from: http://origin.cpc.ncep.noaa.gov/products/analysis_monitoring/ensostuff/ONI_v5.php |
is used to characterize inter-annual variability in SST anomalies. The ONI is a measure of El Niño defined by
NOAA as “a phenomenon in the equatorial Pacific Ocean characterized by a five consecutive 3-month running mean of SST anomalies in the Niño 3.4 region that is above (below) the threshold of +0.5°C (-0.5°C).” The ONI categorizes ENSO events from “extreme” to “weak” (Figure L-7). For example, the “extreme” El Niño event in 1997–1998 was followed by a “very strong” La Niña event in 1998–2000. “Strong” La Niña events were also observed in 2007–2008 and 2010–2011. The highest ONI values (>2.5) were recorded during the 2015–2016 El Niño event. ENSO-neutral conditions occurred during much of 2020, with moderate-strong La Niña conditions from August through December.
The Pacific Decadal Oscillation (PDO;
Figure L-8)
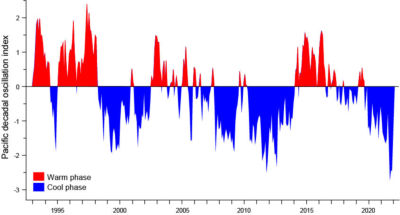 |
| Figure L-8: Monthly values of the Pacific Decadal Oscillation (PDO) Index, January 1993–December 2021. ERSST V5 PDO Time Series data obtained from: https://psl.noaa.gov/pdo/ |
index is used to describe longer-term fluctuations in the Pacific Ocean, and has also been used to explain, for example, the influence of environmental drivers on the vulnerability of silky sharks to fisheries in the EPO (Lennert-Cody
et al. 2018). The PDO—a long-lived El Niño-like pattern of Pacific climate variability, with events persisting 20–30 years—tracks large-scale interdecadal patterns of environmental and biotic changes, primarily in the North Pacific Ocean (Mantua 1997), with secondary patterns observed in the tropical Pacific, the opposite of ENSO (Hare and Mantua 2000). As with ENSO, PDO phases are classified as “warm” or “cool”. PDO values peaked at 2.79 in August 1997 and at 2.62 in April 2016, both of which coincided with the extreme El Niño events indicated by the ONI. The PDO has been in a “cool” phase since early 2020. During 2021, cool conditions intensified towards the end of the year, with a peak PDO value of -2.70 in October. September 2012 was the last time a monthly PDO index occurred at a similar strength (-2.31) (see
ERSST V5 PDO Time series data).
Spatio-temportal exploration of environmental conditionsA time series of SST and chlorophyll-a concentration (CHL-a; an indicator of primary productivity biomass) (Figure L-9)
 |
| Figure L-9: Time-longitude Hovmöller diagram with data averaged across the tropical eastern Pacific Ocean from 5°N to 5°S for mean monthly SST for January 1993–December 2021 (top panel) (https://www.esrl.noaa.gov/psd/) and mean monthly chlorophyll-a concentration for January 2003–December 2021 (bottom panel) (https://coastwatch.pfeg.noaa.gov/erddap/info/erdMH1chlamday/index.html) |
in the eastern tropical Pacific (ETP) from 5°N to 5°S—the same latitudinal band used in the ONI—was explored to show the variability in these variables across space and time using time-longitude Hovmöller diagrams. The SST time series show mean monthly values from 1993–2021, while that for CHL-a concentrations covers data for 2003–2021 due to data availability. The SST plot (Figure L-9, top panel) clearly shows the extension of warmer waters during the extreme El Niño events of 1997–1998 and 2015–2016 and cooler waters during the strong La Niña events in 1999–2000, 2007–2008 and 2010–2011 across the ETP. The CHL-a plot (Figure L-9, bottom panel), although the pattern is less clear than the SST plot, shows an increase in CHL-a concentrations following the strong La Niña events in 2007–2008 and 2010–2011, likely due to increases in nutrient availability.
Environmental conditions and distribution of catchesThe availability of fish, and thus catches, are strongly related to environmental conditions and processes, particularly in pelagic waters (Fiedler and Lavín 2017; Chassot
et al. 2011). ENSO conditions are influenced by many oceanic and atmospheric factors, but both SST and CHL-a levels are known to be good explanatory variables to describe and predict the habitat and distributions of oceanic animals (Hobday and Hartog 2014).
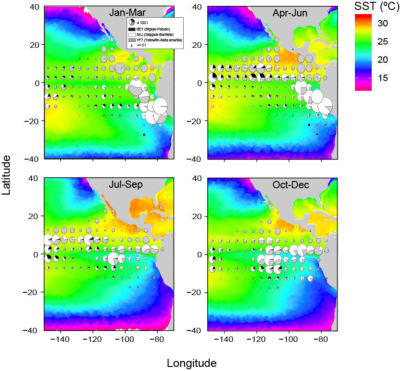 |
| Figure L-10: Mean sea surface temperature (SST) for each quarter during 2021 with catches of tropical tunas overlaid. SST data obtained from NOAA NMFS SWFSC ERD on January 12, 2022, “Multi-scale Ultra-high Resolution (MUR) SST Analysis fv04.1, Global, 0.01°, 2002–present, Monthly”, https://coastwatch.pfeg.noaa.gov/erddap/info/jplMURSST41mday/index.html. |
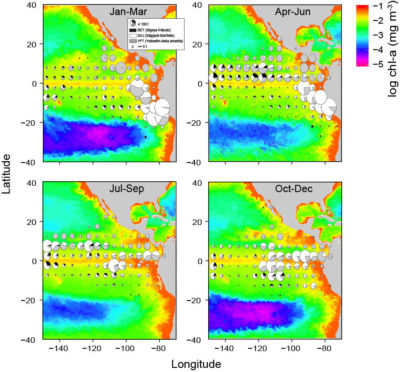 |
| Figure L-11: Mean log chlorophyll-a concentration (in mg m3) for each quarter during 2021 with catches of tropical tunas overlaid. Chlorophyll data obtained from NOAA CoastWatch on January 20, 2022, “Chlorophyll, NOAA, VIIRS, Science Quality, Global, Level 3, 2012-present, Monthly”, NOAA NMFS SWFSC ERD, https://coastwatch.pfeg.noaa.gov/erddap/info/nesdisVHNSQchlaMonthly/index.html. |
Figures L-10 and L-11
show quarterly mean SSTs and CHL-a concentrations, respectively, to: 1) provide a general indication of seasonal environmental variability, and 2) overlay the distribution of tropical tuna catches, as a first step, to illustrate the potential influence of environmental conditions on catches across the EPO during 2021. In future, the staff plans to incorporate the catch distribution of key bycatch species and develop species distribution models (SDMs) to better describe potential relationships between environment and species. In 2021-2022, SDMs have been developed for the leatherback sea turtle (
BYC-11-01) and 32 species of sharks (
SAC-13-11) and several high-resolution SDMs are underway for other sensitive bycatch species.
Figure L-10 shows cooler waters occurred off northern Mexico and the southwestern United States north of 20°N and extended westwards during quarters 1 (January–March) and 2 (April–June), and off South America, south of the equator and east of 100°W, in quarters 3 (July–September) and 4 (October–December). Warmer waters developed off Central America and extended westwards during quarters 2 and 3 but retracted in quarter 4. A secondary warm pool was observed in the southwestern EPO (10–20°S, 140°–150°W) during quarters 1 and 2.
Figure L-11 shows CHL-a concentrations were highest along the equator and the coast of the Americas year-round. The oligotrophic (An area of low productivity, nutrients, and surface chlorophyll, often referred to as an “oceanic desert”.) South Pacific Gyre—located between around 20°–40°S and extending from 150°–90°W—was present in quarter 1, slightly retracted in quarters 2 and 3, and returned in quarter 4.
During quarters 1 and 2, skipjack predominated in the catches in the cooler waters (~25°C) off the coast of South America (Fig. L-10), where CHL-a concentration was high (Fig. L-11). Yellowfin tuna was the predominant tuna species in the catch primarily north of the equator and east of 120°W during these same quarters; warmer water occurred in quarter 2. During quarters 3 and 4, the tuna catches along the coast of South America decreased as cooler waters expanded throughout the region. Bigeye tuna catches mostly occurred south of 10°N with larger catches taken west of ~110°W, particularly in quarter 2. No tuna catches occurred in the oligotrophic gyre located approximately south of 20°S and the western boundary of the EPO (150°W) to about 100°W.
IDENTIFICATION OF SPECIES AT RISKThe primary goal of EAFM is to ensure the long-term sustainability of all species impacted—directly or indirectly—by fishing. However, this is a significant challenge for fisheries that interact with many non-target species with diverse life histories, for which reliable catch and biological data for single-species assessments are lacking. An alternative for such data-limited situations, reflected in
Goal L of the SSP, are Ecological Risk Assessments (ERAs), vulnerability assessments that are designed to identify and prioritize at-risk species for data collection, research and management.
‘Vulnerability’ is defined as the potential for the productivity of a stock to be diminished by the direct and indirect impacts of fishing activities. The IATTC staff has applied qualitative assessments, using Productivity-Susceptibility Analysis (PSA) to estimate the relative vulnerability of data-limited, non-target species caught in the EPO by large purse-seine vessels (Duffy
et al. 2019) and by the longline fishery (
SAC-08-07d).
Because PSA is unable to quantitatively estimate the cumulative effects of multiple fisheries on data-poor bycatch species, a new approach—Ecological Assessment of Sustainable Impacts of Fisheries (EASI-Fish)—was developed by the IATTC staff in 2018 (
SAC-09-12) to overcome this issue. This flexible, spatially-explicit method uses a smaller set of parameters than PSA to first produce a proxy for the fishing mortality rate (
F) of each species, based on the ‘volumetric overlap’ of each fishery on the geographic distribution of these species. The estimate of
F is then used in length-structured yield and spawning biomass per-recruit models to assess the vulnerability of each species using conventional biological reference points (
e.g., FMSY, SPR
40%).
EASI-Fish was successfully applied to 24 species representing a range of life histories, including tunas, billfishes, tuna-like species, elasmobranchs, sea turtles and cetaceans caught in EPO tuna fisheries as a ‘proof of concept’ in 2018 (
SAC-09-12). It was subsequently used to assess the vulnerability status of the spinetail devil ray (
Mobula mobular), caught by all industrial tuna fisheries in the EPO (
BYC-09-01), and the EPO stock of the critically-endangered leatherback turtle (
Dermochelys coriacea) (
BYC-10 INF-B,
BYC-11-02). Therefore, it was decided in the SSP that EASI-Fish will be used in future to assess the vulnerability of all species groups (
e.g., elasmobranchs, sea turtles, teleosts) impacted by EPO tuna fisheries. In 2022, EASI-Fish was used to assess the vulnerability of the eastern Pacific leatherback turtle and shark bycatch species in EPO tuna fisheries and the results were presented at BYC-11 (
BYC-11-02) and SAC-13, respectively (
SAC-13-11).
ECOSYSTEM DYNAMICSAlthough vulnerability assessments (
e.g., EASI-Fish) are useful for assessing the ecological impacts of fishing by assessing the populations of individual species, ecosystem models are required to detect changes in the structure and internal dynamics of an ecosystem. These models are generally data- and labor-intensive to construct, and consequently, few fisheries worldwide have access to a reliable ecosystem model to guide conservation and management measures. These models require a good understanding of ecosystem components and the direction and magnitude of the trophic flows between them, which require detailed ecological studies involving stomach contents and/or stable isotope studies. Purposefully, IATTC staff have had a long history of undertaking such trophic studies, including the experimental determination of consumption estimates of yellowfin tuna at the NMFS Kewalo Basin facility on Oahu, HI in the 1980s, to more recent analyses of stomach content and stable isotope analysis of a range of top-level predators.
In 2003, the IATTC staff compiled the trophic data to complete the development of a model of the pelagic ecosystem in the tropical EPO (IATTC Bulletin,
Vol. 22, No. 3)—named “ETP7”—to explore how fishing and climate variation might affect target species (
e.g., tunas), byproduct species (
e.g., wahoo, dorado), elasmobranchs (
e.g., sharks), forage groups (
e.g., flyingfishes, squids) and species of conservation importance (
e.g., sea turtles, cetaceans). A simplified food-web diagram, with approximate trophic levels (TLs), from the model is shown in Figure L-12.
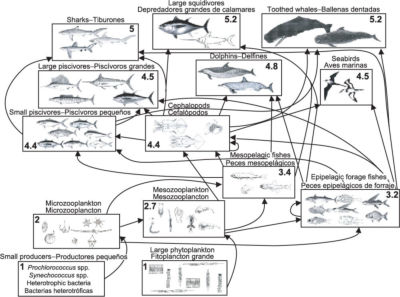 |
| Figure L-12: Simplified food-web diagram of the pelagic ecosystem in the tropical EPO. The numbers inside the boxes indicate the approximate trophic level of each group. |
The model was calibrated to time series of biomass and catch data for a number of target species for 1961–1998. There have been significant improvements in data collection programs in the EPO since 1998, that has allowed the model to be updated with these new data up to 2018 (“ETP8”). Ecological indicators were derived from this updated model and are described below.
Ecological IndicatorsSince 2017, ETP8 has been used in the
Ecosystem Considerations report to provide annual values for seven ecological indicators that, together, can identify changes in the structure and internal dynamics of the ETP ecosystem. These indicators are: mean trophic level of the catch (TL
c), the Marine Trophic Index (MTI), the Fishing in Balance (FIB) index, Shannon’s index, and the mean trophic level of the modelled community for trophic levels 2.0–3.25 (TL
2.0), ≥3.25–4.0 (TL
3.5), and >4.0 (TL
4.0). A full description of these indicators is provided in
SAC-10-14. Additionally, simulations using the version of ETP8 updated and rebalanced in 2021 (“ETP-21”) were conducted to assess potential impacts of the FAD fishery on the structure of the ecosystem (
SAC-12-13).
The update in 2021 was required due to a significant change in how the IATTC staff have reclassified the catch data submitted by the CPCs for “other gears” into longline and other gear types following an internal review of the data. This resulted in a dramatic increase in reported longline catches of high trophic level predators (sharks), which can have a strong influence on ecosystem dynamics. Annual catch estimates by species for 1993–2018 were assigned to the relevant functional groups in the ETP-21 model, which was then rebalanced and recalibrated to time series data to provide an updated ecosystem status for 2021 (
SAC-12-13).
Ecological indicators showed that values for TL
c and MTI decreased from their peak of 4.77 and 4.83 in 1991 to 4.64 and 4.65 in 2018, respectively, as the purse-seine fishing effort on FADs significantly increased (Figure L-13),
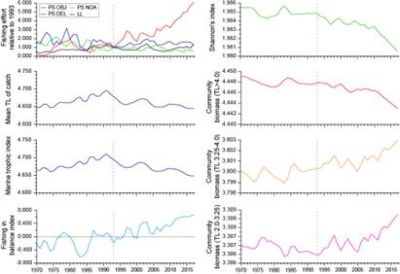 |
| Figure L-13: Annual values for seven ecological indicators of changes in different components of the tropical EPO ecosystem, 1979–2018 (see Ecosystem Dynamics of text for details), and an index of longline (LL) and purse-seine (PS) fishing effort, by set type (dolphin (DEL), unassociated (NOA), floating object (OBJ)), relative to the model start year of 1993 (vertical dashed line), when the expansion of the purse-seine fishery on FADs began. |
where there was increasing catches of high trophic level bycatch species that tend to aggregate around floating objects (
e.g., sharks, billfish, wahoo and dorado). Since its peak in 1991, TL
c declined by 0.05 of a trophic level in the subsequent 28 years, or 0.04 trophic levels per decade. The expansion of the FAD fishery is also seen in the FIB index that exceeds zero after 1990, as well as the continual change in the evenness of biomass of the community indicated by Shannon’s index.
The above indicators generally describe the change in the exploited components of the ecosystem, whereas community biomass indicators describe changes in the structure of the ecosystem once biomass has been removed due to fishing. The biomass of the TL
MC4.0 community was at one of its highest values (4.493) in 1986 but has continued to decline to 4.470 in 2018 (Figure L-13). As a result of changes in predation pressure on lower trophic levels, between 1993 and 2018 the biomass of the TL
MC3.25 community increased from 3.801 to 3.829, while interestingly, the biomass of the TL
MC2.0 community also increased from 3.092 to 3.107.
Together, these indicators show that the ecosystem structure has likely changed over the 40-year analysis period. The consistent patterns of change in each ecological indicator, particularly in the mean trophic level of the communities since 1993, certainly warrant the continuation, and ideally an expansion, of monitoring programs for fisheries in the EPO.


 Thunnus albacares
  Katsuwonus pelamis
  Thunnus obesus
  Thunnus alalunga
  Tetrapturus audax
  Xiphias gladius
